\n
## Diagram: Spatial Representation with Rectangular Regions
### Overview
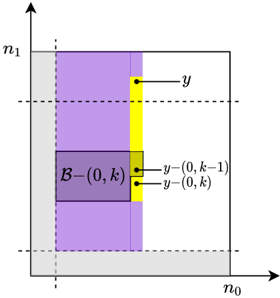
The image depicts a two-dimensional space defined by axes labeled *n₀* and *n₁*. The space is partitioned into several rectangular regions colored in shades of gray, yellow, and purple. Annotations indicate specific points and a labeled region *B−(0, k)*. Dashed lines are present, suggesting boundaries or levels within the space. This appears to be a visual representation of a mathematical or computational concept involving spatial partitioning.
### Components/Axes
* **Axes:**
* *n₀* (horizontal axis)
* *n₁* (vertical axis)
* **Regions:**
* Light Gray: Occupies the bottom and left portions of the space.
* Yellow: A vertical strip in the center-right.
* Purple: The largest region, filling the majority of the space.
* **Annotations:**
* "y": A point within the yellow region, near the top.
* "y−(0, k−1)": A point within the purple region, below "y".
* "y−(0, k)": A point within the purple region, below "y−(0, k−1)".
* "B−(0, k)": A rectangular region within the purple area, near the bottom-left.
* **Lines:**
* Dashed horizontal lines: Two dashed lines are present, defining levels or boundaries within the space.
* Dashed vertical line: A dashed vertical line separates the gray and purple regions.
### Detailed Analysis or Content Details
The diagram shows a partitioning of a two-dimensional space. The axes *n₀* and *n₁* define the coordinate system. The purple region dominates the space, with the yellow region acting as a vertical strip intersecting it. The gray region occupies the bottom-left corner.
The annotations indicate specific points within these regions. The point "y" is located in the yellow region. The points "y−(0, k−1)" and "y−(0, k)" are located within the purple region, positioned vertically below "y". The region "B−(0, k)" is a rectangular area within the purple region.
There are no numerical values provided on the axes, so the scale is unknown. The positions of the points are relative to the regions and the dashed lines.
### Key Observations
* The points "y", "y−(0, k−1)", and "y−(0, k)" appear to be aligned vertically, suggesting a relationship based on the *n₀* coordinate.
* The region "B−(0, k)" is contained entirely within the purple region.
* The dashed lines may represent boundaries or levels of a process or function.
* The diagram is purely geometric and does not contain any quantitative data.
### Interpretation
This diagram likely represents a state space or a domain partitioning in a mathematical or computational context. The regions could represent different states or categories, and the points could represent specific instances or values within those states. The notation "B−(0, k)" suggests a set or region indexed by *k*. The points "y−(0, k−1)" and "y−(0, k)" might represent previous or current states in a sequence.
The absence of numerical values on the axes indicates that the diagram is intended to illustrate a conceptual relationship rather than a precise quantitative one. The diagram could be used to visualize an algorithm, a decision tree, or a state transition diagram. The dashed lines could represent thresholds or boundaries that determine the state of a system.
Without further context, it is difficult to determine the exact meaning of the diagram. However, it clearly demonstrates a spatial partitioning and the relationships between different regions and points within that space.