## Diagram: 2D Coordinate System with Labeled Regions and Points
### Overview
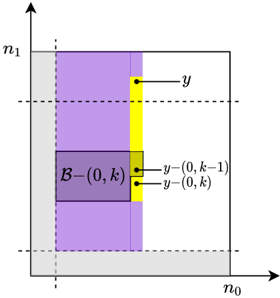
The image is a technical diagram illustrating a two-dimensional coordinate system with labeled axes, shaded regions, and specific points. It appears to represent a mathematical or computational concept, likely related to sets, regions, or intervals in a discrete or continuous space defined by axes `n0` and `n1`.
### Components/Axes
* **Axes:**
* Horizontal axis: Labeled `n0` at the far right end.
* Vertical axis: Labeled `n1` at the top end.
* Both axes have arrowheads indicating positive direction.
* **Coordinate Grid:** The diagram is bounded by a square frame. Dashed lines extend from the axes into the plot area, suggesting a grid or reference lines.
* **Shaded Regions:**
* A large, light gray rectangular region fills most of the lower-left quadrant, bounded by the axes and the outer frame.
* A purple rectangular region is nested within the gray area. It is labeled `B-(0, k)` in its lower-left corner.
* A vertical yellow strip is positioned immediately to the right of the purple region, extending from the bottom of the purple region upwards.
* **Labeled Points:**
* A black dot labeled `y` is located in the upper-right portion of the diagram, within the white (unshaded) area.
* Two black dots are located within the yellow strip, near its right edge. The upper dot is labeled `y-(0, k-1)`. The lower dot is labeled `y-(0, k)`.
### Detailed Analysis
* **Spatial Relationships:**
* The purple region `B-(0, k)` is anchored at or near the origin (bottom-left corner of the axes).
* The yellow strip shares its left boundary with the right boundary of the purple region.
* The points `y-(0, k-1)` and `y-(0, k)` are vertically aligned within the yellow strip, with `y-(0, k-1)` above `y-(0, k)`.
* The point `y` is isolated in the unshaded region, positioned above and to the right of the yellow strip.
* **Text Transcription:**
* Axis Labels: `n0`, `n1`
* Region Label: `B-(0, k)` (The notation suggests a set or ball defined by parameters 0 and k).
* Point Labels: `y`, `y-(0, k-1)`, `y-(0, k)` (The notation suggests points derived from or related to `y` and parameter `k`).
### Key Observations
* The diagram uses color (gray, purple, yellow) to distinguish between different conceptual regions or sets.
* The labeling suggests a hierarchical or sequential relationship between the points `y-(0, k-1)` and `y-(0, k)`, and their relationship to the region `B-(0, k)`.
* The point `y` is visually separate from the shaded regions and the other labeled points, possibly representing an external or target point.
### Interpretation
This diagram likely illustrates a concept from fields like computational geometry, optimization, or machine learning (e.g., support vector machines, nearest neighbor search, or region-based classification).
* **What it suggests:** The setup implies a process of comparing a point `y` to a defined region `B-(0, k)` and specific boundary points `y-(0, k-1)` and `y-(0, k)`. The yellow strip may represent a boundary zone, a margin, or a set of candidate points adjacent to the main region `B`.
* **Relationships:** The core relationship is between the query point `y` and the structured space defined by `B-(0, k)` and its adjacent points. The diagram may be showing how `y` is evaluated against this structure—perhaps checking if it falls within `B`, or measuring its distance to the boundary points.
* **Notable Anomalies/Patterns:** The precise vertical alignment of `y-(0, k-1)` and `y-(0, k)` within the narrow yellow strip is a key pattern. It suggests these points are of particular importance, possibly representing critical thresholds or vertices along a boundary. The isolation of `y` emphasizes its role as the external element being analyzed in relation to the constructed geometry.
**Language Note:** All text in the image is in English, using mathematical notation.