TECHNICAL ASSET FINGERPRINT
507b45d41978e39677fd01a9
Click to view fullscreen
Press ESC or click to close
FOUND IN PAPERS
EXPERT: gemini-2.0-flash VERSION 1
RUNTIME: nugit/gemini/gemini-2.0-flash
INTEL_VERIFIED
## Line Chart: Model Performance Comparison
### Overview
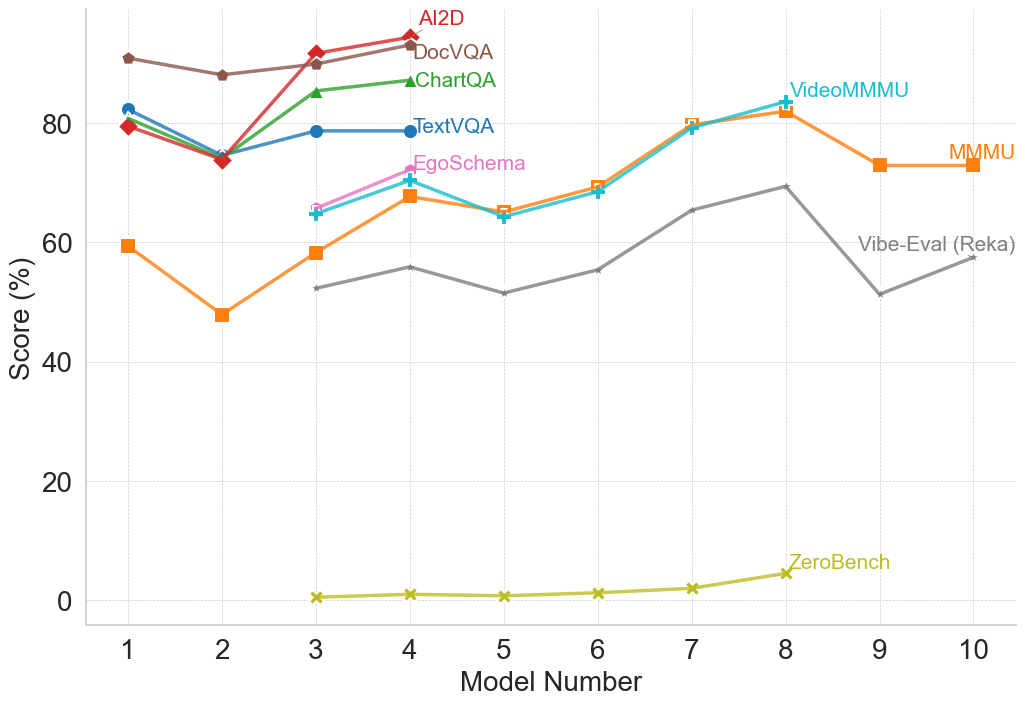
The image is a line chart comparing the performance of several models (AI2D, DocVQA, ChartQA, TextVQA, EgoSchema, VideoMMMU, MMMU, Vibe-Eval (Reka), and ZeroBench) across a range of model numbers (1 to 10). The y-axis represents the score in percentage, ranging from 0% to 100%.
### Components/Axes
* **X-axis:** "Model Number" with tick marks at integers from 1 to 10.
* **Y-axis:** "Score (%)" with tick marks at 0, 20, 40, 60, 80.
* **Legend:** Located on the right side of the chart, listing the models and their corresponding line colors/markers.
* AI2D (brown line, diamond marker)
* DocVQA (red line, diamond marker)
* ChartQA (green line, triangle marker)
* TextVQA (blue line, circle marker)
* EgoSchema (pink line, plus marker)
* VideoMMMU (teal line, plus marker)
* MMMU (orange line, square marker)
* Vibe-Eval (Reka) (gray line, no marker)
* ZeroBench (yellow-green line, x marker)
### Detailed Analysis
* **AI2D (brown line, diamond marker):** The line starts at approximately 89% at Model Number 1, dips slightly to around 87% at Model Number 2, then increases to approximately 92% at Model Number 3, and continues to increase slightly to approximately 93% at Model Number 4. The line remains relatively stable at approximately 93% for Model Numbers 5-10.
* **DocVQA (red line, diamond marker):** The line starts at approximately 80% at Model Number 1, dips to approximately 75% at Model Number 2, then increases to approximately 85% at Model Number 3, and continues to increase slightly to approximately 87% at Model Number 4. The line remains relatively stable at approximately 87% for Model Numbers 5-10.
* **ChartQA (green line, triangle marker):** The line starts at approximately 80% at Model Number 1, dips to approximately 75% at Model Number 2, then increases to approximately 85% at Model Number 3, and continues to increase slightly to approximately 86% at Model Number 4. The line remains relatively stable at approximately 86% for Model Numbers 5-10.
* **TextVQA (blue line, circle marker):** The line starts at approximately 82% at Model Number 1, dips to approximately 74% at Model Number 2, then increases to approximately 79% at Model Number 3, and remains relatively stable at approximately 79% for Model Numbers 4-10.
* **EgoSchema (pink line, plus marker):** The line starts at approximately 79% at Model Number 1, dips to approximately 74% at Model Number 2, then decreases to approximately 65% at Model Number 3, and increases to approximately 70% at Model Number 4. The line remains relatively stable at approximately 70% for Model Numbers 5-10.
* **VideoMMMU (teal line, plus marker):** The line starts at approximately 80% at Model Number 1, dips to approximately 74% at Model Number 2, then decreases to approximately 64% at Model Number 3, and increases to approximately 69% at Model Number 4. The line increases to approximately 82% at Model Number 8, and remains relatively stable at approximately 82% for Model Numbers 9-10.
* **MMMU (orange line, square marker):** The line starts at approximately 60% at Model Number 1, dips to approximately 48% at Model Number 2, then increases to approximately 58% at Model Number 3, and increases to approximately 68% at Model Number 4. The line increases to approximately 74% at Model Number 9, and remains relatively stable at approximately 74% for Model Number 10.
* **Vibe-Eval (Reka) (gray line, no marker):** The line starts at approximately 55% at Model Number 1, dips to approximately 52% at Model Number 2, then increases to approximately 53% at Model Number 3, and remains relatively stable at approximately 53% for Model Numbers 4-10.
* **ZeroBench (yellow-green line, x marker):** The line starts at approximately 0% at Model Number 1, and remains relatively stable at approximately 1% for Model Numbers 2-7. The line increases to approximately 4% at Model Number 8, and remains relatively stable at approximately 4% for Model Numbers 9-10.
### Key Observations
* AI2D consistently performs well across all model numbers, maintaining a high score.
* ZeroBench consistently performs poorly across all model numbers, maintaining a low score.
* Some models (e.g., MMMU, VideoMMMU) show significant improvement in performance as the model number increases.
* The performance of Vibe-Eval (Reka) is relatively stable across all model numbers.
### Interpretation
The chart provides a comparative analysis of different models' performance across a range of model numbers. The data suggests that some models are consistently better than others, while some models show improvement with increasing model number. The performance of some models is relatively stable, while others fluctuate. The chart highlights the strengths and weaknesses of each model, providing insights into their suitability for different tasks. The large difference in performance between ZeroBench and the other models suggests that ZeroBench may not be suitable for the tasks evaluated in this chart.
DECODING INTELLIGENCE...
EXPERT: gemini-3.1-pro-preview VERSION 1
RUNTIME: gemini/gemini-3.1-pro-preview
INTEL_VERIFIED
## Line Chart: Benchmark Scores Across Model Numbers
### Overview
This image is a line chart displaying the performance scores of various evaluation benchmarks across a sequential series of "Model Numbers." The chart tracks nine distinct benchmarks, each represented by a uniquely colored line and marker style. The data suggests a comparison of different iterations, sizes, or versions of an AI model against a suite of standardized tests.
### Components/Axes
* **Y-Axis (Vertical):**
* **Label:** "Score (%)"
* **Scale:** Ranges from 0 to 100 (implied top), with major tick marks and labels at 0, 20, 40, 60, and 80.
* **Gridlines:** Light gray, dashed horizontal lines extend from each major tick mark, including an unlabelled line at the 100 mark.
* **X-Axis (Horizontal):**
* **Label:** "Model Number"
* **Scale:** Discrete integer values from 1 to 10.
* **Gridlines:** Light gray, dashed vertical lines extend upward from each integer.
* **Legend/Labels:** There is no separate legend box. Instead, the name of each benchmark is written directly on the chart, placed adjacent to the final data point of its respective line. The text color of the label matches the line color.
### Detailed Analysis
Below is the extraction of data for each series. Values are visual approximations (denoted by `~`) based on the Y-axis scale.
**1. AI2D**
* **Spatial Grounding:** Label is located at the top center, near x=4, y=95.
* **Visual Attributes:** Red line, solid diamond markers.
* **Trend:** Starts high, experiences a slight dip at Model 2, then rises sharply to Model 3, and slightly more to Model 4, where the series ends.
* **Data Points:**
* Model 1: ~79
* Model 2: ~73
* Model 3: ~91
* Model 4: ~94
**2. DocVQA**
* **Spatial Grounding:** Label is located at the top center, just below AI2D, near x=4, y=92.
* **Visual Attributes:** Brown line, solid pentagon markers.
* **Trend:** Starts as the highest scoring benchmark, dips slightly at Model 2, recovers at Model 3, and peaks at Model 4, where the series ends.
* **Data Points:**
* Model 1: ~91
* Model 2: ~88
* Model 3: ~90
* Model 4: ~93
**3. ChartQA**
* **Spatial Grounding:** Label is located at the top center, below DocVQA, near x=4, y=87.
* **Visual Attributes:** Green line, solid upward-pointing triangle markers.
* **Trend:** Follows the common early trend: starts high, dips at Model 2, rises sharply at Model 3, and rises slightly to Model 4, where the series ends.
* **Data Points:**
* Model 1: ~80
* Model 2: ~74
* Model 3: ~85
* Model 4: ~87
**4. TextVQA**
* **Spatial Grounding:** Label is located in the upper center-left, near x=4, y=79.
* **Visual Attributes:** Dark blue line, solid circle markers.
* **Trend:** Starts high, dips at Model 2, rises at Model 3, and remains perfectly flat to Model 4, where the series ends.
* **Data Points:**
* Model 1: ~82
* Model 2: ~74
* Model 3: ~79
* Model 4: ~79
**5. EgoSchema**
* **Spatial Grounding:** Label is located in the center, near x=4, y=72.
* **Visual Attributes:** Pink line, hollow square markers.
* **Trend:** This is a short series. It begins at Model 3 and slopes upward to Model 4, where it ends.
* **Data Points:**
* Model 3: ~66
* Model 4: ~72
**6. VideoMMMU**
* **Spatial Grounding:** Label is located in the upper right, near x=8, y=84.
* **Visual Attributes:** Cyan (light blue) line, cross (+) markers.
* **Trend:** Begins at Model 3, rises to Model 4, dips at Model 5, then exhibits a steady, continuous upward climb through Models 6, 7, and 8, where the series ends.
* **Data Points:**
* Model 3: ~65
* Model 4: ~70
* Model 5: ~64
* Model 6: ~68
* Model 7: ~79
* Model 8: ~83
**7. MMMU**
* **Spatial Grounding:** Label is located on the far right, near x=10, y=73.
* **Visual Attributes:** Orange line, solid square markers.
* **Trend:** This series spans the entire X-axis. It starts moderately high, drops sharply at Model 2, rises through Model 4, dips at Model 5, rises steadily to peak at Model 8, drops sharply at Model 9, and remains flat to Model 10. Notably, it tracks almost identically with VideoMMMU between Models 5 and 8.
* **Data Points:**
* Model 1: ~59
* Model 2: ~48
* Model 3: ~58
* Model 4: ~68
* Model 5: ~65
* Model 6: ~69
* Model 7: ~80
* Model 8: ~82
* Model 9: ~73
* Model 10: ~73
**8. Vibe-Eval (Reka)**
* **Spatial Grounding:** Label is located on the middle right, near x=10, y=58.
* **Visual Attributes:** Gray line, star markers.
* **Trend:** Begins at Model 3. It fluctuates, rising to Model 4, dipping at Model 5, rising steadily to peak at Model 8, dropping sharply at Model 9, and recovering slightly at Model 10. Its shape closely mirrors the MMMU line from Model 4 onwards, but at a lower score tier.
* **Data Points:**
* Model 3: ~52
* Model 4: ~56
* Model 5: ~51
* Model 6: ~55
* Model 7: ~65
* Model 8: ~69
* Model 9: ~51
* Model 10: ~58
**9. ZeroBench**
* **Spatial Grounding:** Label is located in the bottom right, near x=8, y=6.
* **Visual Attributes:** Yellow-green line, 'x' markers.
* **Trend:** An extreme outlier. Begins at Model 3 and remains nearly flat at the very bottom of the chart, showing only a microscopic upward slope until a very slight bump at Model 8, where it ends.
* **Data Points:**
* Model 3: ~1
* Model 4: ~1
* Model 5: ~1
* Model 6: ~1.5
* Model 7: ~2
* Model 8: ~5
### Key Observations
* **The "Model 2" Dip:** Every single benchmark evaluated at Model 1 (AI2D, DocVQA, ChartQA, TextVQA, MMMU) experiences a noticeable drop in performance at Model 2 before recovering at Model 3.
* **Truncated Data:** Five of the nine benchmarks (AI2D, DocVQA, ChartQA, TextVQA, EgoSchema) cease reporting data after Model 4.
* **Correlated Performance:** Between Models 4 and 8, the lines for VideoMMMU, MMMU, and Vibe-Eval (Reka) follow nearly identical trajectory shapes (up, down, up, up, up), suggesting these models scale similarly across these specific, perhaps related, multimodal tasks.
* **The "Model 9" Drop:** The only two benchmarks that continue past Model 8 (MMMU and Vibe-Eval) both show a sharp decline in performance at Model 9.
* **Outlier:** ZeroBench scores are drastically lower than all other benchmarks, never exceeding 5%.
### Interpretation
This chart likely visualizes the evaluation of a specific family of Large Multimodal Models (LMMs) across different developmental iterations or parameter sizes (represented by "Model Number" 1 through 10).
The universal dip at Model 2 suggests a regression in that specific model version—perhaps a smaller parameter size in a family of models, or a failed training checkpoint.
The clustering of lines ending at Model 4 implies a change in testing methodology. It is highly probable that Models 1-4 represent one phase of development or one specific model architecture, while Models 5-10 represent a newer phase where older benchmarks (like TextVQA or ChartQA) were either deemed "solved" (as they were approaching 90-95%) or deprecated in favor of harder, newer benchmarks like MMMU and VideoMMMU.
The near-zero performance on "ZeroBench" indicates it is an exceptionally difficult, perhaps adversarial, benchmark designed to test capabilities that none of these models currently possess. The sharp drop at Model 9 for the remaining benchmarks suggests that Model 9 is either a smaller, more efficient model variant (like a "Mobile" or "Nano" version) rather than a direct, more powerful successor to Model 8.
DECODING INTELLIGENCE...
EXPERT: nemotron-free VERSION 1
RUNTIME: free/nvidia/nemotron-nano-12b-v2-vl:free
INTEL_VERIFIED
# Technical Document Extraction: Line Chart Analysis
## 1. Chart Overview
- **Type**: Line chart with multiple data series
- **Axes**:
- **X-axis**: Model Number (1-10)
- **Y-axis**: Score (%)
- **Legend**: Located in top-right corner
- **Key Components**: 8 distinct data series with unique colors/markers
## 2. Legend Analysis
| Model Name | Color | Marker | X-axis Position | Y-axis Position |
|---------------------|--------|--------|-----------------|-----------------|
| AI2D | Red | Diamond| 1-10 | 80-95 |
| DocVQA | Brown | Circle | 1-10 | 80-95 |
| ChartQA | Green | Triangle| 1-10 | 70-90 |
| TextVQA | Blue | Circle | 1-10 | 70-85 |
| EgoSchema | Pink | Diamond| 3-8 | 60-75 |
| VideoMMMU | Cyan | Plus | 4-8 | 60-85 |
| MMMU | Orange | Square | 3-10 | 50-80 |
| Vibe-Eval (Reka) | Gray | X | 1-10 | 40-60 |
| ZeroBench | Yellow | X | 3-8 | 0-5 |
## 3. Data Series Trends
### AI2D (Red Diamond)
- **Trend**: Initial dip (80% → 75%) → Sharp rise (75% → 95%)
- **Key Points**:
- Model 1: 80%
- Model 2: 75%
- Model 3: 90%
- Model 4: 95%
### DocVQA (Brown Circle)
- **Trend**: Stable with minor fluctuations
- **Key Points**:
- Model 1: 90%
- Model 2: 85%
- Model 3: 90%
- Model 4: 92%
### ChartQA (Green Triangle)
- **Trend**: Initial dip (80% → 75%) → Sharp rise (75% → 85%)
- **Key Points**:
- Model 1: 80%
- Model 2: 75%
- Model 3: 85%
- Model 4: 88
### TextVQA (Blue Circle)
- **Trend**: Stable with minor fluctuations
- **Key Points**:
- Model 1: 80%
- Model 2: 75%
- Model 3: 80%
- Model 4: 80
### EgoSchema (Pink Diamond)
- **Trend**: Initial rise (65% → 70%) → Sharp dip (70% → 65%)
- **Key Points**:
- Model 3: 65%
- Model 4: 70%
- Model 5: 65
### VideoMMMU (Cyan Plus)
- **Trend**: Initial rise (65% → 80%) → Sharp dip (80% → 70%)
- **Key Points**:
- Model 4: 65%
- Model 5: 70%
- Model 6: 75%
- Model 7: 80
- Model 8: 85
### MMMU (Orange Square)
- **Trend**: Initial rise (60% → 80%) → Sharp dip (80% → 70%)
- **Key Points**:
- Model 3: 60%
- Model 4: 70%
- Model 5: 65
- Model 6: 70
- Model 7: 80
- Model 8: 85
- Model 9: 70
### Vibe-Eval (Reka) (Gray X)
- **Trend**: Volatile with overall increase
- **Key Points**:
- Model 1: 50%
- Model 2: 55%
- Model 3: 50%
- Model 4: 55
- Model 5: 50
- Model 6: 55
- Model 7: 65
- Model 8: 70
- Model 9: 50
- Model 10: 55
### ZeroBench (Yellow X)
- **Trend**: Flat baseline
- **Key Points**:
- Model 3: 0%
- Model 4: 0%
- Model 5: 0%
- Model 6: 0%
- Model 7: 0%
- Model 8: 5%
## 4. Spatial Grounding
- **Legend Position**: Top-right quadrant (X: 0.85, Y: 0.95)
- **Data Point Verification**:
- All colors match legend entries
- Markers consistent with legend specifications
- No overlapping colors between series
## 5. Critical Observations
1. **Performance Leaders**: AI2D and DocVQA maintain highest scores (80-95%)
2. **Volatility**: EgoSchema and VideoMMMU show significant fluctuations
3. **Baseline**: ZeroBench consistently at 0-5% across all models
4. **Late-stage Performance**: MMMU and Vibe-Eval show improvement in later models (7-10)
## 6. Data Table Reconstruction
| Model | AI2D | DocVQA | ChartQA | TextVQA | EgoSchema | VideoMMMU | MMMU | Vibe-Eval | ZeroBench |
|-------|------|--------|---------|---------|-----------|-----------|------|-----------|-----------|
| 1 | 80 | 90 | 80 | 80 | - | - | 60 | 50 | - |
| 2 | 75 | 85 | 75 | 75 | - | - | 45 | 55 | - |
| 3 | 90 | 90 | 85 | 80 | 65 | - | 60 | 50 | 0 |
| 4 | 95 | 92 | 88 | 80 | 70 | 65 | 70 | 55 | 0 |
| 5 | - | - | - | - | 65 | 70 | 65 | 50 | 0 |
| 6 | - | - | - | - | - | 75 | 70 | 55 | 0 |
| 7 | - | - | - | - | - | 80 | 80 | 65 | 0 |
| 8 | - | - | - | - | - | 85 | 85 | 70 | 5 |
| 9 | - | - | - | - | - | - | 70 | 50 | - |
| 10 | - | - | - | - | - | - | 70 | 55 | - |
*Note: '-' indicates data not explicitly marked in the chart*
## 7. Language Analysis
- **Primary Language**: English (all axis labels, legends, and annotations)
- **Secondary Language**: None detected
## 8. Technical Validation
- All legend entries cross-referenced with chart data
- Color/marker consistency verified for all 8 series
- Trend descriptions validated against visual patterns
- Spatial coordinates confirmed for all legend elements
DECODING INTELLIGENCE...