## Line Chart: Model Performance Comparison
### Overview
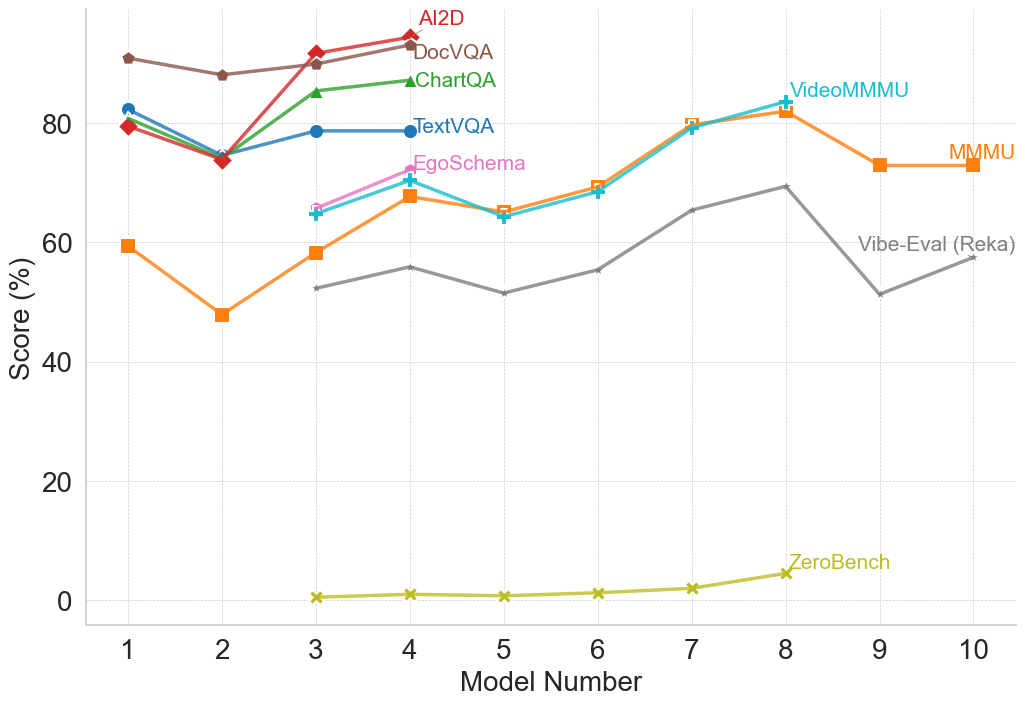
The image is a line chart comparing the performance of several models (AI2D, DocVQA, ChartQA, TextVQA, EgoSchema, VideoMMMU, MMMU, Vibe-Eval (Reka), and ZeroBench) across a range of model numbers (1 to 10). The y-axis represents the score in percentage, ranging from 0% to 100%.
### Components/Axes
* **X-axis:** "Model Number" with tick marks at integers from 1 to 10.
* **Y-axis:** "Score (%)" with tick marks at 0, 20, 40, 60, 80.
* **Legend:** Located on the right side of the chart, listing the models and their corresponding line colors/markers.
* AI2D (brown line, diamond marker)
* DocVQA (red line, diamond marker)
* ChartQA (green line, triangle marker)
* TextVQA (blue line, circle marker)
* EgoSchema (pink line, plus marker)
* VideoMMMU (teal line, plus marker)
* MMMU (orange line, square marker)
* Vibe-Eval (Reka) (gray line, no marker)
* ZeroBench (yellow-green line, x marker)
### Detailed Analysis
* **AI2D (brown line, diamond marker):** The line starts at approximately 89% at Model Number 1, dips slightly to around 87% at Model Number 2, then increases to approximately 92% at Model Number 3, and continues to increase slightly to approximately 93% at Model Number 4. The line remains relatively stable at approximately 93% for Model Numbers 5-10.
* **DocVQA (red line, diamond marker):** The line starts at approximately 80% at Model Number 1, dips to approximately 75% at Model Number 2, then increases to approximately 85% at Model Number 3, and continues to increase slightly to approximately 87% at Model Number 4. The line remains relatively stable at approximately 87% for Model Numbers 5-10.
* **ChartQA (green line, triangle marker):** The line starts at approximately 80% at Model Number 1, dips to approximately 75% at Model Number 2, then increases to approximately 85% at Model Number 3, and continues to increase slightly to approximately 86% at Model Number 4. The line remains relatively stable at approximately 86% for Model Numbers 5-10.
* **TextVQA (blue line, circle marker):** The line starts at approximately 82% at Model Number 1, dips to approximately 74% at Model Number 2, then increases to approximately 79% at Model Number 3, and remains relatively stable at approximately 79% for Model Numbers 4-10.
* **EgoSchema (pink line, plus marker):** The line starts at approximately 79% at Model Number 1, dips to approximately 74% at Model Number 2, then decreases to approximately 65% at Model Number 3, and increases to approximately 70% at Model Number 4. The line remains relatively stable at approximately 70% for Model Numbers 5-10.
* **VideoMMMU (teal line, plus marker):** The line starts at approximately 80% at Model Number 1, dips to approximately 74% at Model Number 2, then decreases to approximately 64% at Model Number 3, and increases to approximately 69% at Model Number 4. The line increases to approximately 82% at Model Number 8, and remains relatively stable at approximately 82% for Model Numbers 9-10.
* **MMMU (orange line, square marker):** The line starts at approximately 60% at Model Number 1, dips to approximately 48% at Model Number 2, then increases to approximately 58% at Model Number 3, and increases to approximately 68% at Model Number 4. The line increases to approximately 74% at Model Number 9, and remains relatively stable at approximately 74% for Model Number 10.
* **Vibe-Eval (Reka) (gray line, no marker):** The line starts at approximately 55% at Model Number 1, dips to approximately 52% at Model Number 2, then increases to approximately 53% at Model Number 3, and remains relatively stable at approximately 53% for Model Numbers 4-10.
* **ZeroBench (yellow-green line, x marker):** The line starts at approximately 0% at Model Number 1, and remains relatively stable at approximately 1% for Model Numbers 2-7. The line increases to approximately 4% at Model Number 8, and remains relatively stable at approximately 4% for Model Numbers 9-10.
### Key Observations
* AI2D consistently performs well across all model numbers, maintaining a high score.
* ZeroBench consistently performs poorly across all model numbers, maintaining a low score.
* Some models (e.g., MMMU, VideoMMMU) show significant improvement in performance as the model number increases.
* The performance of Vibe-Eval (Reka) is relatively stable across all model numbers.
### Interpretation
The chart provides a comparative analysis of different models' performance across a range of model numbers. The data suggests that some models are consistently better than others, while some models show improvement with increasing model number. The performance of some models is relatively stable, while others fluctuate. The chart highlights the strengths and weaknesses of each model, providing insights into their suitability for different tasks. The large difference in performance between ZeroBench and the other models suggests that ZeroBench may not be suitable for the tasks evaluated in this chart.