\n
## Line Chart: Model Performance Comparison
### Overview
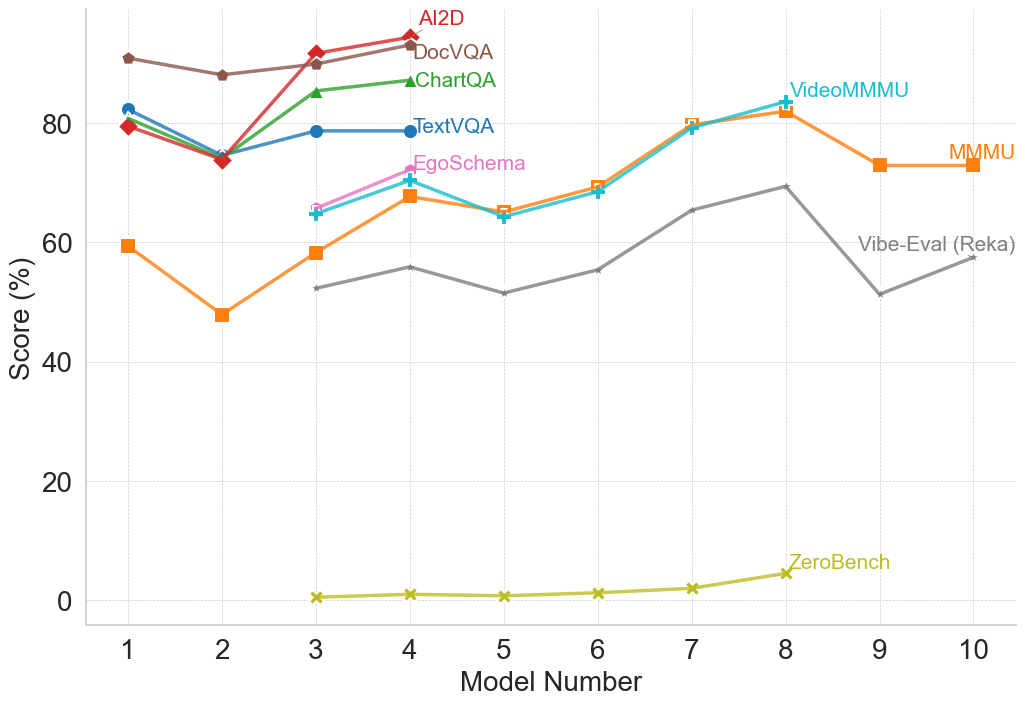
This line chart compares the performance scores of several models across a range of model numbers (1 to 10). The y-axis represents the score in percentage, while the x-axis represents the model number. The chart displays the performance trends of six different models: Ai2D, DocVQA, ChartQA, TextVQA, EgoSchema, VideoMMMU, MMMU, Vibe-Eval (Reka), and ZeroBench.
### Components/Axes
* **X-axis:** Model Number (1 to 10)
* **Y-axis:** Score (%) - Scale ranges from 0 to 80, with increments of 20.
* **Legend:** Located at the top-center of the chart, identifying each line with a unique color.
* Ai2D (Red)
* DocVQA (Dark Green)
* ChartQA (Light Green)
* TextVQA (Blue)
* EgoSchema (Purple)
* VideoMMMU (Cyan)
* MMMU (Orange)
* Vibe-Eval (Reka) (Gray)
* ZeroBench (Yellow)
### Detailed Analysis
Here's a breakdown of each model's performance trend and approximate data points:
* **Ai2D (Red):** Starts at approximately 84% at Model 1, decreases to around 78% at Model 2, then increases to a peak of approximately 88% at Model 3. It then declines to around 80% at Model 7, and remains relatively stable around 80% through Model 10.
* **DocVQA (Dark Green):** Begins at approximately 78% at Model 1, drops sharply to around 55% at Model 2, then rises to approximately 75% at Model 3. It fluctuates between 70% and 75% from Models 4 to 9, and then decreases to around 70% at Model 10.
* **ChartQA (Light Green):** Starts at approximately 75% at Model 1, decreases to around 65% at Model 2, then increases to approximately 80% at Model 3. It remains relatively stable around 70-75% from Models 4 to 9, and then decreases to around 65% at Model 10.
* **TextVQA (Blue):** Starts at approximately 80% at Model 1, decreases to around 70% at Model 2, then increases to approximately 82% at Model 3. It fluctuates between 70% and 80% from Models 4 to 9, and then decreases to around 75% at Model 10.
* **EgoSchema (Purple):** Begins at approximately 70% at Model 1, decreases to around 60% at Model 2, then increases to approximately 72% at Model 3. It remains relatively stable around 65-75% from Models 4 to 9, and then decreases to around 65% at Model 10.
* **VideoMMMU (Cyan):** Starts at approximately 60% at Model 1, decreases to around 50% at Model 2, then increases to approximately 78% at Model 8. It then decreases to around 75% at Model 10.
* **MMMU (Orange):** Starts at approximately 75% at Model 1, decreases to around 65% at Model 2, then increases to approximately 78% at Model 3. It remains relatively stable around 70-80% from Models 4 to 9, and then decreases to around 72% at Model 10.
* **Vibe-Eval (Reka) (Gray):** Starts at approximately 60% at Model 1, decreases to around 55% at Model 2, then increases to approximately 62% at Model 3. It remains relatively stable around 55-65% from Models 4 to 9, and then decreases to around 58% at Model 10.
* **ZeroBench (Yellow):** Starts at approximately 0% at Model 1, and remains very low (close to 0%) until Model 8, where it increases to approximately 5%. It remains around 5% at Model 10.
### Key Observations
* Ai2D consistently performs well, generally maintaining scores above 80% after Model 2.
* ZeroBench consistently performs poorly, with scores near 0% throughout most of the model numbers.
* VideoMMMU shows a significant increase in performance around Model 8.
* DocVQA, ChartQA, TextVQA, and EgoSchema exhibit similar performance trends, fluctuating between 60% and 80%.
* The performance of most models peaks around Model 3.
### Interpretation
The chart demonstrates a comparison of different models' performance on a specific task, likely a question-answering or reasoning task related to visual or textual data. The varying performance levels suggest that different models excel at different aspects of the task. Ai2D appears to be the most robust model, consistently achieving high scores. ZeroBench's consistently low scores indicate it may be a baseline model or one that requires further development. The increase in VideoMMMU's performance at Model 8 could indicate a specific improvement or optimization implemented at that stage. The similar trends among DocVQA, ChartQA, TextVQA, and EgoSchema suggest they may share similar underlying architectures or training data. The initial dip in performance for most models at Model 2 could be due to a challenging subset of the data or a specific aspect of the task that requires more sophisticated reasoning. Overall, the chart provides valuable insights into the strengths and weaknesses of different models and can guide future research and development efforts.