## Donut Chart: KGoT Runtime Distribution
### Overview
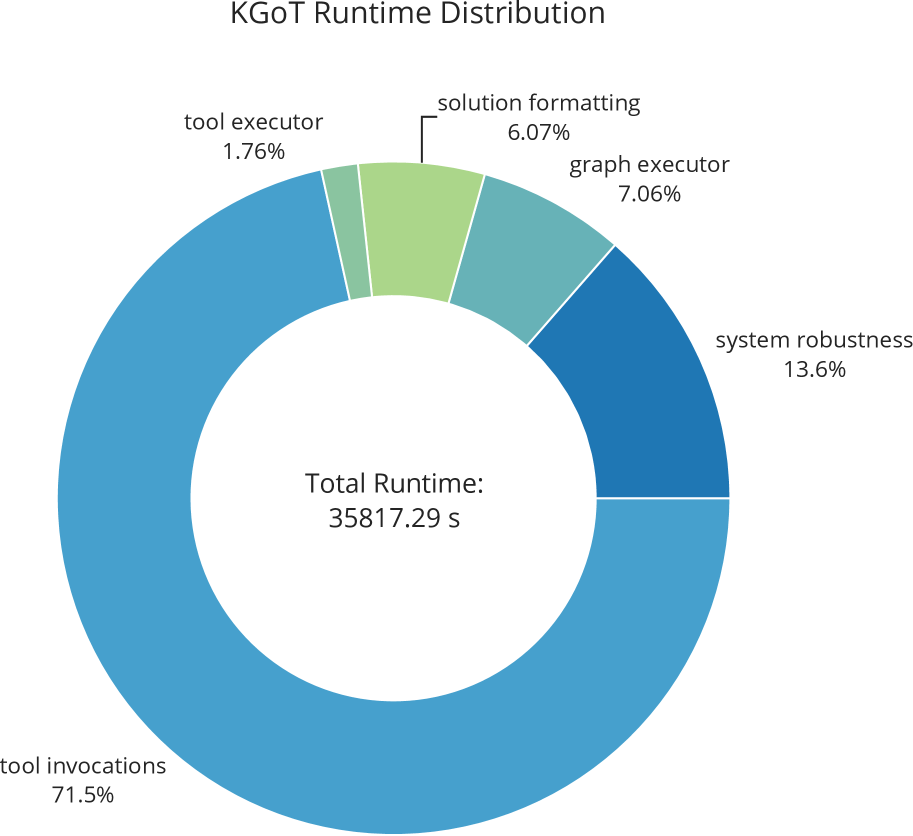
The image is a donut chart illustrating the runtime distribution of KGoT, broken down into five categories: tool invocations, system robustness, graph executor, solution formatting, and tool executor. The chart displays the percentage of total runtime each category consumes. The total runtime is also provided.
### Components/Axes
* **Title:** KGoT Runtime Distribution
* **Categories:**
* tool invocations
* system robustness
* graph executor
* solution formatting
* tool executor
* **Total Runtime:** 35817.29 s
### Detailed Analysis
* **tool invocations:** 71.5% (Light Blue) - This category accounts for the largest portion of the runtime.
* **system robustness:** 13.6% (Dark Blue) - The second largest portion of the runtime.
* **graph executor:** 7.06% (Teal) - A smaller, but still significant, portion of the runtime.
* **solution formatting:** 6.07% (Light Green) - A smaller portion of the runtime.
* **tool executor:** 1.76% (Pale Green) - This category accounts for the smallest portion of the runtime.
### Key Observations
* tool invocations dominate the runtime, accounting for nearly three-quarters of the total.
* tool executor has the smallest runtime percentage.
* The total runtime is 35817.29 seconds.
### Interpretation
The donut chart clearly shows that tool invocations are the most time-consuming aspect of the KGoT runtime. System robustness also contributes a significant portion. The other three categories (graph executor, solution formatting, and tool executor) have relatively smaller contributions to the overall runtime. This suggests that optimizing tool invocations would likely have the greatest impact on reducing the total runtime of KGoT.