\n
## Donut Chart: KGOT Runtime Distribution
### Overview
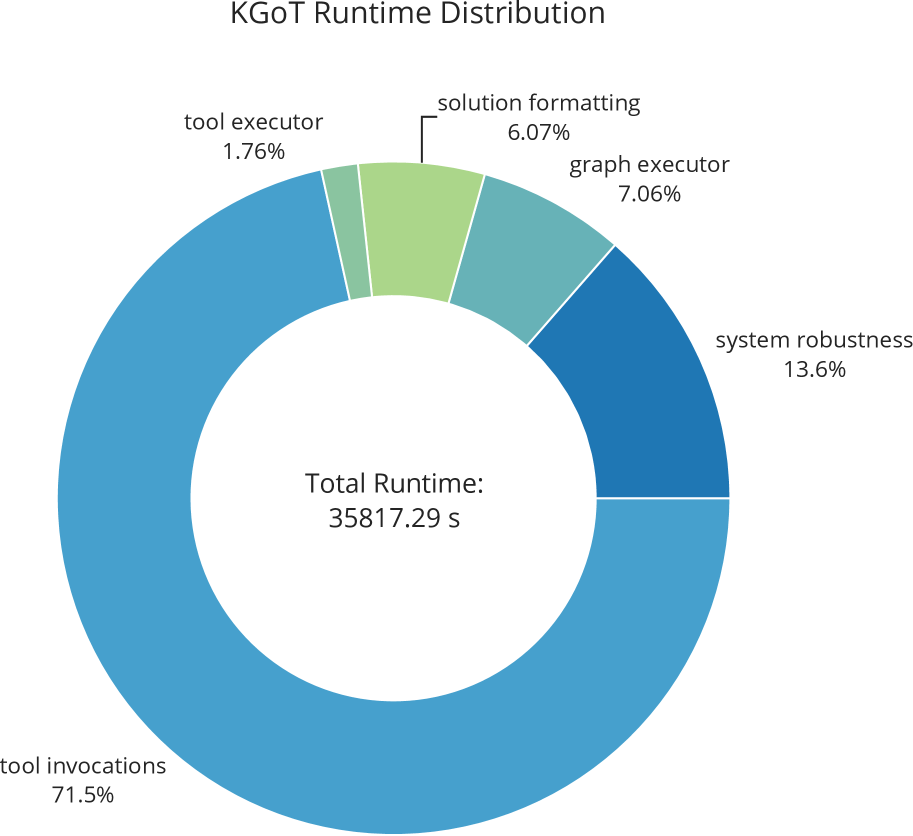
This image presents a donut chart illustrating the distribution of runtime for various components within the KGOT system. The chart displays the percentage of total runtime allocated to each component, with the total runtime explicitly stated in seconds.
### Components/Axes
* **Title:** KGOT Runtime Distribution
* **Center Text:** Total Runtime: 35817.29 s
* **Categories (Segments):**
* tool invocations
* tool executor
* solution formatting
* graph executor
* system robustness
* **Percentage Labels:** Each segment is labeled with its corresponding percentage of the total runtime.
* **Color Scheme:**
* tool invocations: Blue
* tool executor: Gray
* solution formatting: Light Green
* graph executor: Teal
* system robustness: Dark Blue
### Detailed Analysis
The donut chart shows a clear dominance of "tool invocations" in terms of runtime consumption. Let's analyze each segment:
1. **tool invocations:** This segment occupies the largest portion of the chart, representing approximately 71.5% of the total runtime.
2. **tool executor:** This segment is relatively small, accounting for approximately 1.76% of the total runtime.
3. **solution formatting:** This segment represents approximately 6.07% of the total runtime.
4. **graph executor:** This segment accounts for approximately 7.06% of the total runtime.
5. **system robustness:** This segment represents approximately 13.6% of the total runtime.
### Key Observations
* The vast majority of the runtime (71.5%) is spent on "tool invocations." This suggests that the process of calling and managing external tools is the most time-consuming aspect of the KGOT system.
* "tool executor" consumes a very small percentage of the runtime, indicating that the execution of individual tools is relatively fast.
* "solution formatting" and "graph executor" contribute moderate amounts to the total runtime.
* "system robustness" accounts for a significant portion (13.6%) of the runtime, suggesting that ensuring the system's stability and reliability is a substantial undertaking.
### Interpretation
The data suggests that optimizing the "tool invocations" process would yield the most significant performance improvements for the KGOT system. This could involve streamlining the tool calling mechanism, reducing the number of tool invocations, or improving the efficiency of the tools themselves. The relatively low runtime of the "tool executor" indicates that the tools themselves are not the primary bottleneck. The substantial runtime dedicated to "system robustness" highlights the importance of maintaining a stable and reliable system, potentially through extensive testing and error handling. The chart provides a clear breakdown of where the system's time is spent, allowing developers to focus their optimization efforts on the most impactful areas. The total runtime of 35817.29 seconds provides a baseline for measuring the effectiveness of any performance improvements.