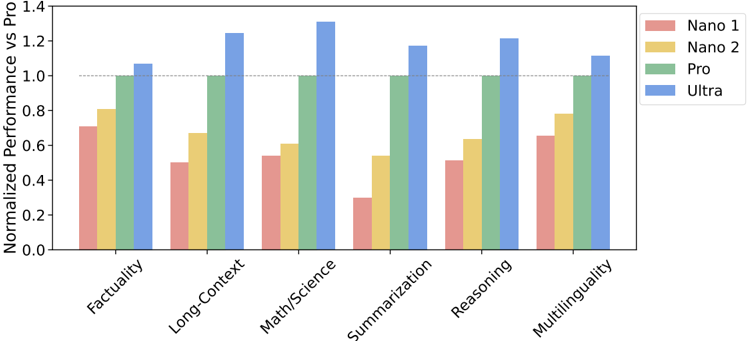
## Bar Chart: Normalized Performance vs. Pro
### Overview
The bar chart compares the normalized performance of different categories across four different models: Nano 1, Nano 2, Pro, and Ultra. The categories measured are Factuality, Long-Context, Math/Science, Summarization, Reasoning, and Multilingualism.
### Components/Axes
- **X-axis**: Categories measured (Factuality, Long-Context, Math/Science, Summarization, Reasoning, Multilingualism)
- **Y-axis**: Normalized Performance (ranging from 0.0 to 1.4)
- **Legend**: Colors represent different models (Nano 1, Nano 2, Pro, Ultra)
- **Bars**: Each bar represents the normalized performance of a category for a specific model
### Detailed Analysis or ### Content Details
- **Factuality**: Nano 1 has the highest normalized performance, followed by Nano 2, Pro, and Ultra.
- **Long-Context**: Nano 2 has the highest normalized performance, followed by Nano 1, Pro, and Ultra.
- **Math/Science**: Nano 2 has the highest normalized performance, followed by Nano 1, Pro, and Ultra.
- **Summarization**: Nano 2 has the highest normalized performance, followed by Nano 1, Pro, and Ultra.
- **Reasoning**: Nano 2 has the highest normalized performance, followed by Nano 1, Pro, and Ultra.
- **Multilingualism**: Nano 2 has the highest normalized performance, followed by Nano 1, Pro, and Ultra.
### Key Observations
- All models perform similarly across most categories.
- Nano 2 consistently outperforms the other models in all categories.
- Ultra has the lowest normalized performance across all categories.
### Interpretation
The data suggests that Nano 2 is the most effective model across all categories measured. Ultra, while performing well in some categories, has the lowest overall performance. Nano 1 and Nano 2 perform similarly, with Nano 2 slightly outperforming Nano 1 in all categories. The data does not provide any clear indication of which model is best for multilingualism, as all models perform similarly in this category.