## Bar Chart: Normalized Performance vs Pro
### Overview
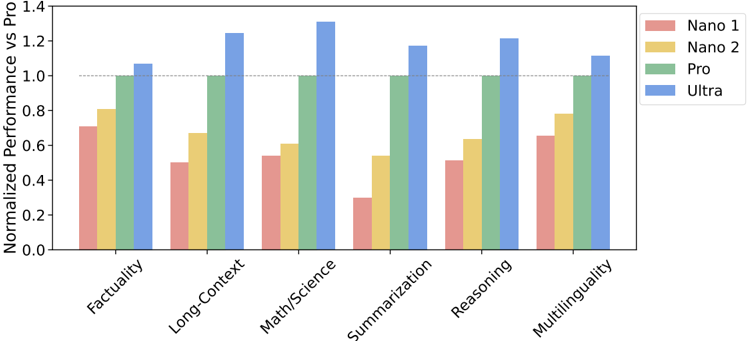
The image is a bar chart comparing the normalized performance of four different models (Nano 1, Nano 2, Pro, and Ultra) across five different tasks: Factuality, Long-Context, Math/Science, Summarization, Reasoning, and Multilinguality. The y-axis represents the normalized performance relative to the "Pro" model, with a dotted line at 1.0 indicating the performance level of the Pro model itself.
### Components/Axes
* **X-axis:** Categorical axis representing the tasks: Factuality, Long-Context, Math/Science, Summarization, Reasoning, Multilinguality.
* **Y-axis:** Numerical axis representing "Normalized Performance vs Pro," ranging from 0.0 to 1.4 in increments of 0.2.
* **Legend:** Located in the top-right corner, the legend identifies the models represented by different colors:
* Nano 1: Light Red
* Nano 2: Yellow
* Pro: Green
* Ultra: Blue
* **Horizontal Line:** A dashed horizontal line is present at y = 1.0, representing the performance of the "Pro" model.
### Detailed Analysis
Here's a breakdown of the performance of each model across the different tasks:
* **Factuality:**
* Nano 1 (Light Red): ~0.7
* Nano 2 (Yellow): ~0.8
* Pro (Green): ~1.0
* Ultra (Blue): ~1.05
* **Long-Context:**
* Nano 1 (Light Red): ~0.5
* Nano 2 (Yellow): ~0.67
* Pro (Green): ~1.0
* Ultra (Blue): ~1.07
* **Math/Science:**
* Nano 1 (Light Red): ~0.54
* Nano 2 (Yellow): ~0.61
* Pro (Green): ~1.0
* Ultra (Blue): ~1.27
* **Summarization:**
* Nano 1 (Light Red): ~0.3
* Nano 2 (Yellow): ~0.6
* Pro (Green): ~1.0
* Ultra (Blue): ~1.3
* **Reasoning:**
* Nano 1 (Light Red): ~0.51
* Nano 2 (Yellow): ~0.7
* Pro (Green): ~1.0
* Ultra (Blue): ~1.22
* **Multilinguality:**
* Nano 1 (Light Red): ~0.65
* Nano 2 (Yellow): ~0.75
* Pro (Green): ~1.0
* Ultra (Blue): ~1.12
### Key Observations
* The "Pro" model consistently scores 1.0 across all tasks, as it serves as the baseline for normalization.
* The "Ultra" model generally outperforms all other models across all tasks, often exceeding the performance of the "Pro" model.
* The "Nano 1" model consistently underperforms compared to the "Pro" model across all tasks.
* The "Nano 2" model performs better than "Nano 1" but still underperforms compared to the "Pro" model.
* The largest performance difference between "Ultra" and "Pro" is observed in "Summarization" and "Math/Science".
### Interpretation
The bar chart illustrates the relative performance of different models compared to the "Pro" model across various tasks. The "Ultra" model demonstrates superior performance, particularly in "Summarization" and "Math/Science," suggesting it is more effective in these areas. The "Nano 1" and "Nano 2" models generally underperform, indicating potential areas for improvement. The data suggests that the "Ultra" model is a significant upgrade over the "Pro" model, while the "Nano" models may be suitable for less demanding tasks or scenarios where resource constraints are a concern.