\n
## Bar Chart: Normalized Performance vs Pro
### Overview
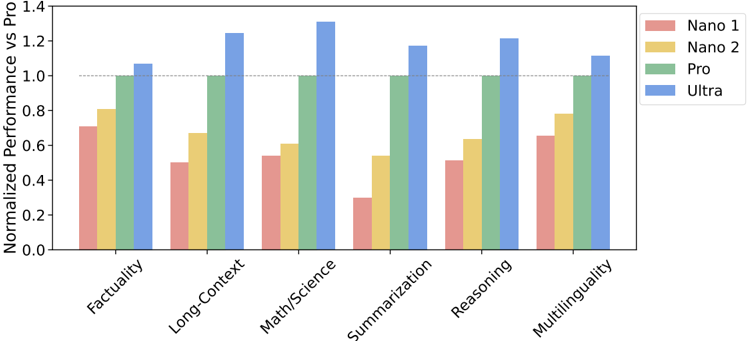
This bar chart compares the normalized performance of four different models (Nano 1, Nano 2, Pro, and Ultra) across six different tasks: Factuality, Long-Context, Math/Science, Summarization, Reasoning, and Multilinguality. The performance is normalized against the "Pro" model, with values greater than 1.0 indicating better performance than the Pro model and values less than 1.0 indicating worse performance.
### Components/Axes
* **X-axis:** Task Name (Factuality, Long-Context, Math/Science, Summarization, Reasoning, Multilinguality)
* **Y-axis:** Normalized Performance vs Pro (Scale from 0.0 to 1.4)
* **Legend:**
* Nano 1 (represented by a reddish-orange color)
* Nano 2 (represented by a yellow color)
* Pro (represented by a green color)
* Ultra (represented by a blue color)
### Detailed Analysis
The chart consists of grouped bar plots for each task, with each group containing four bars representing the performance of the four models.
* **Factuality:**
* Nano 1: Approximately 0.82
* Nano 2: Approximately 0.95
* Pro: 1.00
* Ultra: Approximately 1.02
* **Long-Context:**
* Nano 1: Approximately 0.65
* Nano 2: Approximately 1.25
* Pro: 1.00
* Ultra: Approximately 1.10
* **Math/Science:**
* Nano 1: Approximately 0.32
* Nano 2: Approximately 0.65
* Pro: 1.00
* Ultra: Approximately 1.35
* **Summarization:**
* Nano 1: Approximately 0.55
* Nano 2: Approximately 0.98
* Pro: 1.00
* Ultra: Approximately 1.05
* **Reasoning:**
* Nano 1: Approximately 0.75
* Nano 2: Approximately 1.15
* Pro: 1.00
* Ultra: Approximately 1.25
* **Multilinguality:**
* Nano 1: Approximately 0.62
* Nano 2: Approximately 0.98
* Pro: 1.00
* Ultra: Approximately 1.00
### Key Observations
* The "Ultra" model consistently performs at or above the level of the "Pro" model across all tasks.
* "Nano 1" consistently underperforms compared to the other models, particularly in Math/Science.
* "Nano 2" shows significant improvement over "Nano 1" and often approaches or exceeds the performance of the "Pro" model, especially in Long-Context and Reasoning.
* The largest performance difference between models is observed in the Math/Science task, where "Ultra" significantly outperforms all other models.
### Interpretation
The data suggests a clear hierarchy in model performance, with "Ultra" being the most capable and "Nano 1" being the least. The normalization against the "Pro" model provides a useful benchmark for evaluating the relative strengths and weaknesses of each model. The substantial performance gap in Math/Science indicates that this task is particularly challenging and benefits significantly from the capabilities of the "Ultra" model. The improvement from "Nano 1" to "Nano 2" suggests that model architecture or training data adjustments can have a substantial impact on performance. The consistent performance of "Ultra" near or above 1.0 across all tasks indicates a robust and versatile model. The chart demonstrates the trade-offs between model size/complexity and performance, with the larger models ("Pro" and "Ultra") generally achieving better results.