## Grouped Bar Chart: Normalized Performance vs. Pro Model
### Overview
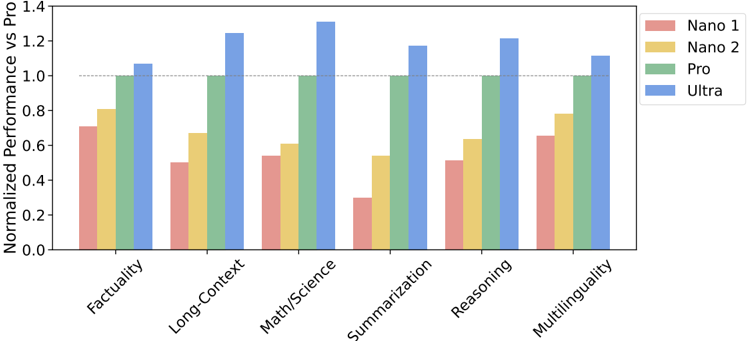
The image displays a grouped bar chart comparing the normalized performance of four AI models (Nano 1, Nano 2, Pro, and Ultra) across six different task categories. Performance is measured relative to the "Pro" model, which serves as the baseline with a normalized score of 1.0 for each category.
### Components/Axes
* **Chart Type:** Grouped Bar Chart.
* **X-Axis (Categories):** Six task categories are listed from left to right: `Factuality`, `Long-Context`, `Math/Science`, `Summarization`, `Reasoning`, `Multilinguality`.
* **Y-Axis (Metric):** Labeled `Normalized Performance vs Pro`. The scale runs from 0.0 to 1.4, with major tick marks at 0.0, 0.2, 0.4, 0.6, 0.8, 1.0, 1.2, and 1.4. A dashed horizontal reference line is drawn at the 1.0 mark.
* **Legend:** Positioned in the top-right corner of the chart area. It maps colors to model names:
* **Pink/Salmon:** `Nano 1`
* **Yellow/Gold:** `Nano 2`
* **Green:** `Pro`
* **Blue:** `Ultra`
### Detailed Analysis
Performance values are approximate, read from the chart's y-axis.
**1. Factuality**
* **Nano 1 (Pink):** ~0.70
* **Nano 2 (Yellow):** ~0.80
* **Pro (Green):** 1.00 (Baseline)
* **Ultra (Blue):** ~1.05
* *Trend:* Performance increases stepwise from Nano 1 to Ultra. All models except Nano 1 are at or above the Pro baseline.
**2. Long-Context**
* **Nano 1 (Pink):** ~0.50
* **Nano 2 (Yellow):** ~0.67
* **Pro (Green):** 1.00
* **Ultra (Blue):** ~1.25
* *Trend:* A clear upward progression. The gap between Pro and Ultra is notably large here.
**3. Math/Science**
* **Nano 1 (Pink):** ~0.54
* **Nano 2 (Yellow):** ~0.60
* **Pro (Green):** 1.00
* **Ultra (Blue):** ~1.30
* *Trend:* Similar upward trend. Ultra shows its highest relative performance in this category.
**4. Summarization**
* **Nano 1 (Pink):** ~0.30
* **Nano 2 (Yellow):** ~0.54
* **Pro (Green):** 1.00
* **Ultra (Blue):** ~1.17
* *Trend:* Upward trend, but Nano 1's performance is the lowest across all categories and models. The jump from Nano 2 to Pro is very significant.
**5. Reasoning**
* **Nano 1 (Pink):** ~0.51
* **Nano 2 (Yellow):** ~0.63
* **Pro (Green):** 1.00
* **Ultra (Blue):** ~1.21
* *Trend:* Consistent upward progression. Performance levels are similar to the Long-Context category.
**6. Multilinguality**
* **Nano 1 (Pink):** ~0.65
* **Nano 2 (Yellow):** ~0.78
* **Pro (Green):** 1.00
* **Ultra (Blue):** ~1.11
* *Trend:* Upward trend. This category shows the smallest performance gap between the Nano models and the Pro baseline.
### Key Observations
1. **Consistent Hierarchy:** In every single task category, the performance order is strictly: Nano 1 < Nano 2 < Pro < Ultra. There are no exceptions or crossovers.
2. **Ultra's Dominance:** The Ultra model (blue bars) consistently outperforms the Pro baseline, with its greatest relative advantage in `Math/Science` (~1.30) and `Long-Context` (~1.25).
3. **Nano 1's Struggle:** The Nano 1 model (pink bars) is consistently the lowest performer. Its most significant underperformance is in `Summarization` (~0.30), where it achieves less than a third of the Pro model's score.
4. **Task Difficulty Spectrum:** The tasks appear to vary in difficulty for the smaller models. `Multilinguality` and `Factuality` seem to be the "easiest" (smallest gap from Pro), while `Summarization` and `Long-Context` appear to be the "hardest" (largest gap from Pro) for the Nano models.
5. **Baseline Integrity:** The Pro model (green bars) correctly sits exactly at the 1.0 reference line for all categories, confirming it is the normalization standard.
### Interpretation
This chart visualizes a clear performance scaling law across model sizes (Nano 1/2, Pro, Ultra) for a suite of standard AI evaluation tasks. The data suggests that:
* **Capability Scaling is Consistent:** Increasing model scale (from Nano to Ultra) yields predictable and monotonic improvements across diverse capabilities, from factual recall to complex reasoning.
* **Task-Dependent Scaling Gains:** The *degree* of improvement from scaling is not uniform. Technical, knowledge-intensive tasks like `Math/Science` and `Long-Context` processing show the most dramatic gains from the largest (Ultra) model. This implies these tasks may be particularly capacity-intensive.
* **The "Summarization" Anomaly:** The drastic underperformance of Nano 1 in `Summarization` is a key outlier. It suggests that this specific task may have a high minimum capability threshold; below a certain model size/quality, performance collapses rather than degrading gracefully.
* **Strategic Implications:** For applications, this indicates that choosing a model involves a trade-off. The Nano models offer lower performance but are likely more efficient. The Pro model represents a balanced baseline. The Ultra model is necessary for pushing the state-of-the-art, especially in technically demanding domains. The consistent hierarchy allows for predictable performance estimation when moving between model tiers.