## Histogram: Bridge Node Persistence Over Time
### Overview
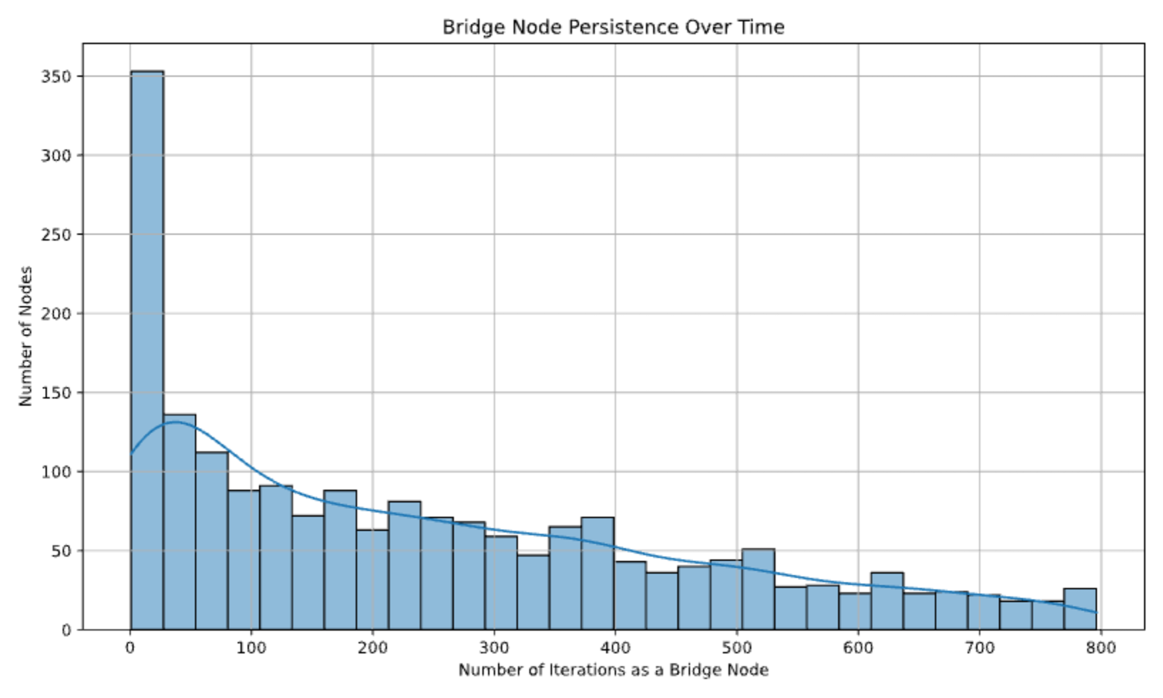
The image is a histogram showing the persistence of bridge nodes over time. The x-axis represents the number of iterations a node acts as a bridge, and the y-axis represents the number of nodes. The histogram bars are light blue with dark blue outlines. A dark blue curve is overlaid on the histogram, representing a smoothed distribution of the data.
### Components/Axes
* **Title:** Bridge Node Persistence Over Time
* **X-axis:** Number of Iterations as a Bridge Node
* Scale: 0 to 800, with tick marks at intervals of 100 (0, 100, 200, 300, 400, 500, 600, 700, 800)
* **Y-axis:** Number of Nodes
* Scale: 0 to 350, with tick marks at intervals of 50 (0, 50, 100, 150, 200, 250, 300, 350)
* **Bars:** Light blue with dark blue outlines.
* **Curve:** Dark blue, overlaid on the histogram.
### Detailed Analysis
The histogram shows a right-skewed distribution. The highest bar is at the beginning of the x-axis, indicating that most bridge nodes have a low number of iterations. As the number of iterations increases, the number of nodes decreases.
* **Bar 1 (0-25 iterations):** Approximately 350 nodes.
* **Bar 2 (25-50 iterations):** Approximately 130 nodes.
* **Bar 3 (50-75 iterations):** Approximately 120 nodes.
* **Bar 4 (75-100 iterations):** Approximately 90 nodes.
* **Bar at 200 iterations:** Approximately 80 nodes.
* **Bar at 300 iterations:** Approximately 60 nodes.
* **Bar at 400 iterations:** Approximately 65 nodes.
* **Bar at 500 iterations:** Approximately 50 nodes.
* **Bar at 600 iterations:** Approximately 30 nodes.
* **Bar at 700 iterations:** Approximately 25 nodes.
* **Bar at 800 iterations:** Approximately 25 nodes.
The dark blue curve follows the general trend of the histogram, showing a rapid decrease in the number of nodes as the number of iterations increases, followed by a more gradual decline.
### Key Observations
* The majority of bridge nodes have a low number of iterations.
* The distribution is right-skewed, indicating that there are a few bridge nodes with a high number of iterations.
* The dark blue curve provides a smoothed representation of the distribution.
### Interpretation
The data suggests that most bridge nodes are not persistent and only act as bridges for a short period. A smaller number of bridge nodes are more persistent and act as bridges for a longer time. The right-skewed distribution indicates that the persistence of bridge nodes follows a power-law distribution, where a small number of nodes are responsible for a large fraction of the bridge functionality. This could be due to various factors, such as node stability, network topology, or routing algorithms. The histogram provides a visual representation of the distribution of bridge node persistence, which can be used to analyze the performance and reliability of the network.