TECHNICAL ASSET FINGERPRINT
5096ca69da0634155dd32f9e
Click to view fullscreen
Press ESC or click to close
FOUND IN PAPERS
EXPERT: gemini-3.1-pro-preview VERSION 1
RUNTIME: gemini/gemini-3.1-pro-preview
INTEL_VERIFIED
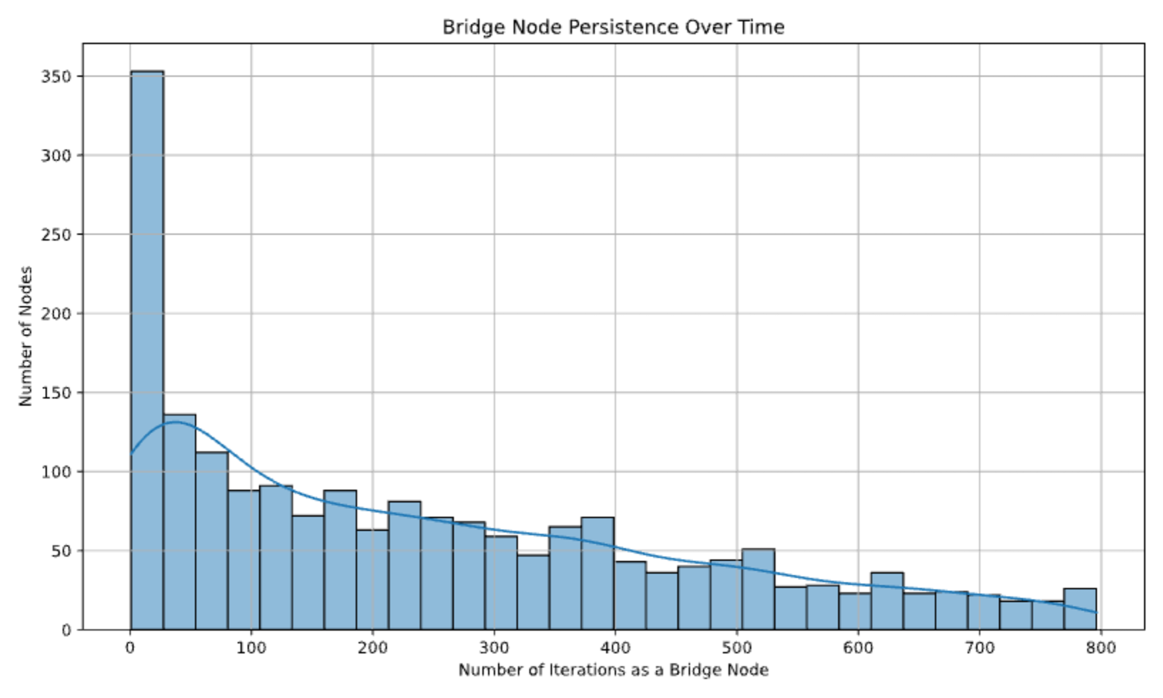
## Histogram: Bridge Node Persistence Over Time
### Overview
This image is a statistical chart, specifically a histogram overlaid with a Kernel Density Estimate (KDE) curve or trend line. It visualizes the frequency distribution of "Bridge Nodes" based on how long they persist (measured in iterations) within a given system or network model. The data exhibits a heavy right-skew (positive skew), indicating that the vast majority of bridge nodes are highly transient, while a small minority persist for a long duration.
### Components/Axes
**1. Header Region (Top)**
* **Chart Title:** "Bridge Node Persistence Over Time" (Positioned top-center, black text).
**2. Main Chart Area (Center)**
* **Grid:** A background grid consisting of light gray lines aligns with the major axis markers, forming a rectangular matrix to aid in reading values.
* **Data Series 1 (Histogram Bars):** 32 contiguous vertical bars.
* *Color:* Light blue fill with thin black outlines.
* *Bin Width:* Based on the x-axis scale (0 to 800) and the presence of 4 bars per 100 units, each bin represents exactly 25 iterations.
* **Data Series 2 (Trend Line):** A continuous, smoothed curve overlaid on the bars.
* *Color:* Solid medium-blue line.
* *Placement:* It begins at approximately y=110 on the y-axis, rises slightly to peak around x=40, and then follows the general declining trend of the histogram bars, smoothing out local variances.
* **Legend:** *None present.* The chart relies on axis labels to define the data.
**3. Left Axis Region (Y-Axis)**
* **Axis Title:** "Number of Nodes" (Rotated 90 degrees counter-clockwise, positioned vertically centered on the left).
* **Axis Scale/Markers:** Linear scale starting at 0 and ending at 350.
* **Tick Marks:** 0, 50, 100, 150, 200, 250, 300, 350.
**4. Footer Region (X-Axis)**
* **Axis Title:** "Number of Iterations as a Bridge Node" (Positioned bottom-center, below the tick markers).
* **Axis Scale/Markers:** Linear scale starting at 0 and ending at 800.
* **Tick Marks:** 0, 100, 200, 300, 400, 500, 600, 700, 800.
### Detailed Analysis
**Trend Verification:**
Visually, the data demonstrates a sharp, immediate peak in the very first bin, followed by a steep drop-off. After the initial drop, the data forms a "long tail" that gradually slopes downward toward the right side of the chart. The overlaid blue line confirms this trend: an initial spike followed by an exponential-like decay, with minor, localized fluctuations (small bumps) along the descent.
**Data Point Extraction (Approximate Values):**
*Note: Values are visually estimated based on the y-axis gridlines (increments of 50). Uncertainty is approximately ±5 units per bar.*
* **Bin 1 (0-25 iterations):** ~353 nodes *(Absolute maximum)*
* **Bin 2 (25-50 iterations):** ~135 nodes
* **Bin 3 (50-75 iterations):** ~112 nodes
* **Bin 4 (75-100 iterations):** ~88 nodes
* **Bin 5 (100-125 iterations):** ~91 nodes
* **Bin 6 (125-150 iterations):** ~72 nodes
* **Bin 7 (150-175 iterations):** ~88 nodes
* **Bin 8 (175-200 iterations):** ~63 nodes
* **Bin 9 (200-225 iterations):** ~81 nodes
* **Bin 10 (225-250 iterations):** ~71 nodes
* **Bin 11 (250-275 iterations):** ~68 nodes
* **Bin 12 (275-300 iterations):** ~59 nodes
* **Bin 13 (300-325 iterations):** ~47 nodes
* **Bin 14 (325-350 iterations):** ~65 nodes
* **Bin 15 (350-375 iterations):** ~71 nodes
* **Bin 16 (375-400 iterations):** ~43 nodes
* **Bin 17 (400-425 iterations):** ~36 nodes
* **Bin 18 (425-450 iterations):** ~40 nodes
* **Bin 19 (450-475 iterations):** ~44 nodes
* **Bin 20 (475-500 iterations):** ~51 nodes
* **Bin 21 (500-525 iterations):** ~27 nodes
* **Bin 22 (525-550 iterations):** ~28 nodes
* **Bin 23 (550-575 iterations):** ~23 nodes
* **Bin 24 (575-600 iterations):** ~36 nodes
* **Bin 25 (600-625 iterations):** ~23 nodes
* **Bin 26 (625-650 iterations):** ~24 nodes
* **Bin 27 (650-675 iterations):** ~22 nodes
* **Bin 28 (675-700 iterations):** ~21 nodes
* **Bin 29 (700-725 iterations):** ~18 nodes
* **Bin 30 (725-750 iterations):** ~17 nodes
* **Bin 31 (750-775 iterations):** ~18 nodes
* **Bin 32 (775-800 iterations):** ~26 nodes
### Key Observations
1. **Extreme Initial Volatility:** The most striking feature is the first bin (0-25 iterations), which contains over 350 nodes. This is more than 2.5 times higher than the second-highest bin.
2. **The Long Tail:** Despite the massive initial drop-off, the distribution does not quickly reach zero. Nodes continue to persist all the way to the 800-iteration mark, maintaining a baseline of roughly 15 to 30 nodes per bin in the latter half of the chart.
3. **Localized Resurgence:** There are minor, localized peaks that interrupt the smooth decay. For example, there are slight bumps at 150-175 iterations (~88 nodes), 200-225 iterations (~81 nodes), and 350-375 iterations (~71 nodes).
4. **End-of-Chart Anomaly:** The final bin (775-800) shows a slight uptick (~26 nodes) compared to the immediately preceding bins (~17-18 nodes). This could indicate a "survivor" grouping or an artificial cutoff in the simulation/data collection at 800 iterations.
### Interpretation
In network theory, a "bridge node" is a critical component that connects distinct clusters or communities; removing it would separate the network or drastically increase the distance between nodes.
**What the data suggests:**
This chart reveals the dynamic, shifting topology of the network being analyzed. The massive spike at the beginning indicates that the vast majority of bridge nodes are highly unstable or transient—they form a bridge for a very brief period (under 25 iterations) before the network shifts and they lose that status.
However, the presence of the long tail demonstrates a structural dichotomy within the network. While most bridges are fleeting, a small, resilient "core" of bridge nodes exists. These nodes maintain their critical bridging status for hundreds of iterations (up to 800).
**Reading between the lines (Peircean investigative):**
The minor bumps in the long tail (e.g., around 150, 200, and 350 iterations) suggest cyclical or phased shifts in the network's topology, where certain groups of nodes collectively gain or lose bridge status at specific intervals. Furthermore, the slight uptick at the 800 mark strongly implies that the simulation or data collection was terminated at 800 iterations, and those ~26 nodes would likely have continued to persist as bridges if the timeline were extended.
Ultimately, this data characterizes a network that is highly fluid at its edges but relies on a very small, deeply entrenched set of nodes to maintain overall global connectivity over long periods.
DECODING INTELLIGENCE...