## Histogram with Trend Line: Bridge Node Persistence Over Time
### Overview
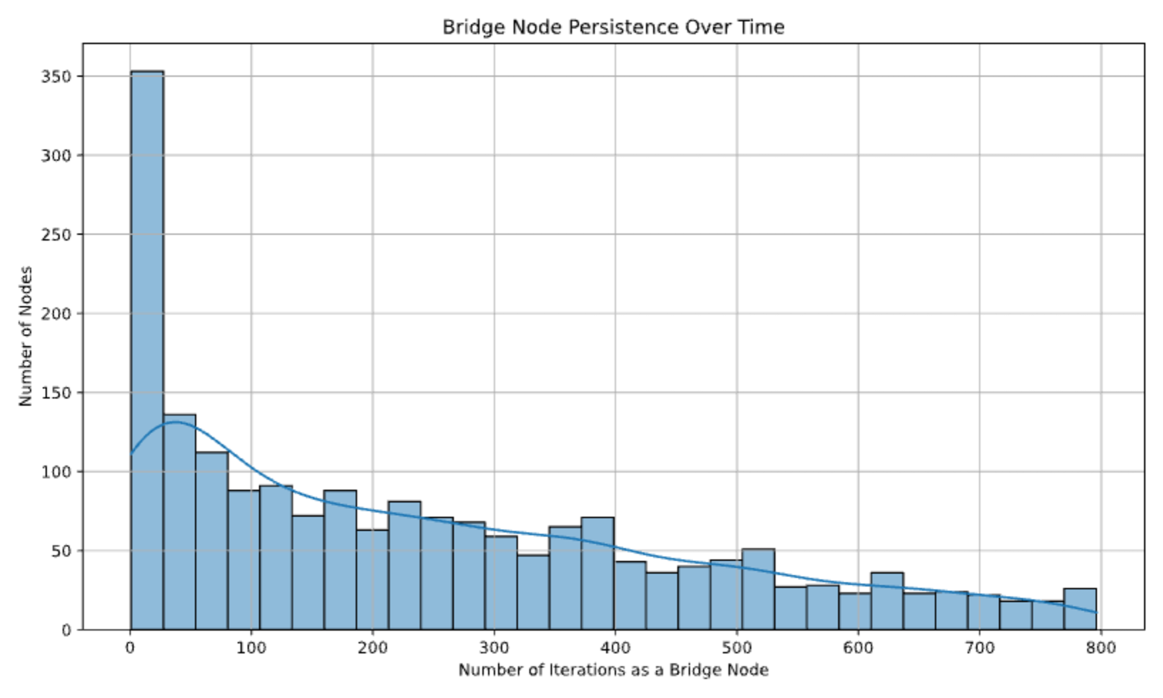
The image displays a histogram titled "Bridge Node Persistence Over Time," illustrating the distribution of how long nodes in a network maintain their role as "bridge nodes." The chart includes a histogram (light blue bars with black outlines) and an overlaid trend line (darker blue). The data is right-skewed, indicating that most bridge nodes persist for a short duration, while a smaller number persist for much longer periods.
### Components/Axes
* **Title:** "Bridge Node Persistence Over Time" (centered at the top).
* **X-Axis:** Labeled "Number of Iterations as a Bridge Node." It is a linear scale ranging from 0 to 800, with major tick marks and grid lines every 100 units (0, 100, 200, ..., 800).
* **Y-Axis:** Labeled "Number of Nodes." It is a linear scale ranging from 0 to 350, with major tick marks and grid lines every 50 units (0, 50, 100, ..., 350).
* **Legend:** There is no explicit legend. The histogram bars and the trend line are the only data series.
* **Grid:** A light gray grid is present, aligned with the major ticks on both axes.
### Detailed Analysis
**Histogram Data (Approximate Values):**
The histogram bins appear to have a width of approximately 25 iterations. The height of each bar represents the count of nodes that persisted for that number of iterations.
* **Bin 0-25:** ~350 nodes (the tallest bar, located at the far left).
* **Bin 25-50:** ~135 nodes.
* **Bin 50-75:** ~110 nodes.
* **Bin 75-100:** ~90 nodes.
* **Bin 100-125:** ~90 nodes.
* **Bin 125-150:** ~70 nodes.
* **Bin 150-175:** ~90 nodes.
* **Bin 175-200:** ~60 nodes.
* **Bin 200-225:** ~80 nodes.
* **Bin 225-250:** ~70 nodes.
* **Bin 250-275:** ~70 nodes.
* **Bin 275-300:** ~60 nodes.
* **Bin 300-325:** ~45 nodes.
* **Bin 325-350:** ~65 nodes.
* **Bin 350-375:** ~70 nodes.
* **Bin 375-400:** ~40 nodes.
* **Bin 400-425:** ~35 nodes.
* **Bin 425-450:** ~40 nodes.
* **Bin 450-475:** ~45 nodes.
* **Bin 475-500:** ~50 nodes.
* **Bin 500-525:** ~25 nodes.
* **Bin 525-550:** ~25 nodes.
* **Bin 550-575:** ~20 nodes.
* **Bin 575-600:** ~35 nodes.
* **Bin 600-625:** ~25 nodes.
* **Bin 625-650:** ~25 nodes.
* **Bin 650-675:** ~20 nodes.
* **Bin 675-700:** ~20 nodes.
* **Bin 700-725:** ~15 nodes.
* **Bin 725-750:** ~15 nodes.
* **Bin 750-775:** ~25 nodes.
* **Bin 775-800:** ~25 nodes.
**Trend Line Analysis:**
The smooth, darker blue trend line represents a fitted curve to the histogram data.
* **Starting Point:** Begins at approximately y=110 when x=0.
* **Peak:** Rises to a peak of approximately y=130 near x=50.
* **Trend:** After the peak, it follows a steady, gradual downward slope across the remainder of the chart.
* **Ending Point:** Ends at approximately y=10 when x=800.
### Key Observations
* **Extreme Right Skew:** The distribution is heavily right-skewed. The single highest frequency is in the first bin (0-25 iterations), containing nearly twice as many nodes as the next bin.
* **Rapid Initial Drop-off:** There is a sharp decline in node count after the first bin, with the count dropping by more than half by the third bin (50-75 iterations).
* **Long Tail:** Despite the rapid initial drop, the histogram has a long tail extending to 800 iterations, showing that a non-trivial number of nodes maintain their bridge role for a very long time.
* **Local Fluctuations:** While the overall trend is downward, there are minor local peaks and valleys in the histogram (e.g., around 150-175, 325-375, and 475-500 iterations), suggesting some variability in persistence durations.
* **Trend Line Confirmation:** The overlaid trend line visually confirms the overall pattern: a brief initial increase followed by a monotonic decrease in the number of nodes as persistence duration increases.
### Interpretation
This chart provides a quantitative view of node role stability within a dynamic network. The data suggests that the "bridge node" role is highly transient for the vast majority of nodes. Most nodes assume this role for only a few dozen iterations before losing it. This could indicate a network with high churn, where connectivity paths are frequently reconfigured, or where the bridge role is competitively or randomly assigned.
The presence of the long tail, however, is significant. It demonstrates that a small subset of nodes are exceptionally stable, persisting as bridges for hundreds of iterations. These nodes likely form the persistent backbone of the network's connectivity. The minor fluctuations in the histogram might correspond to specific network events, protocols, or structural properties that favor certain persistence durations over others.
From a systems perspective, this distribution implies that analyses or optimizations relying on bridge nodes should not assume long-term stability for most nodes. Instead, they must be designed for high turnover, while potentially identifying and leveraging the small set of highly persistent nodes for more stable functions. The trend line provides a simplified model for predicting the expected number of nodes at a given persistence duration, which could be useful for capacity planning or reliability modeling.