## Bar Chart: Bridge Node Persistence Over Time
### Overview
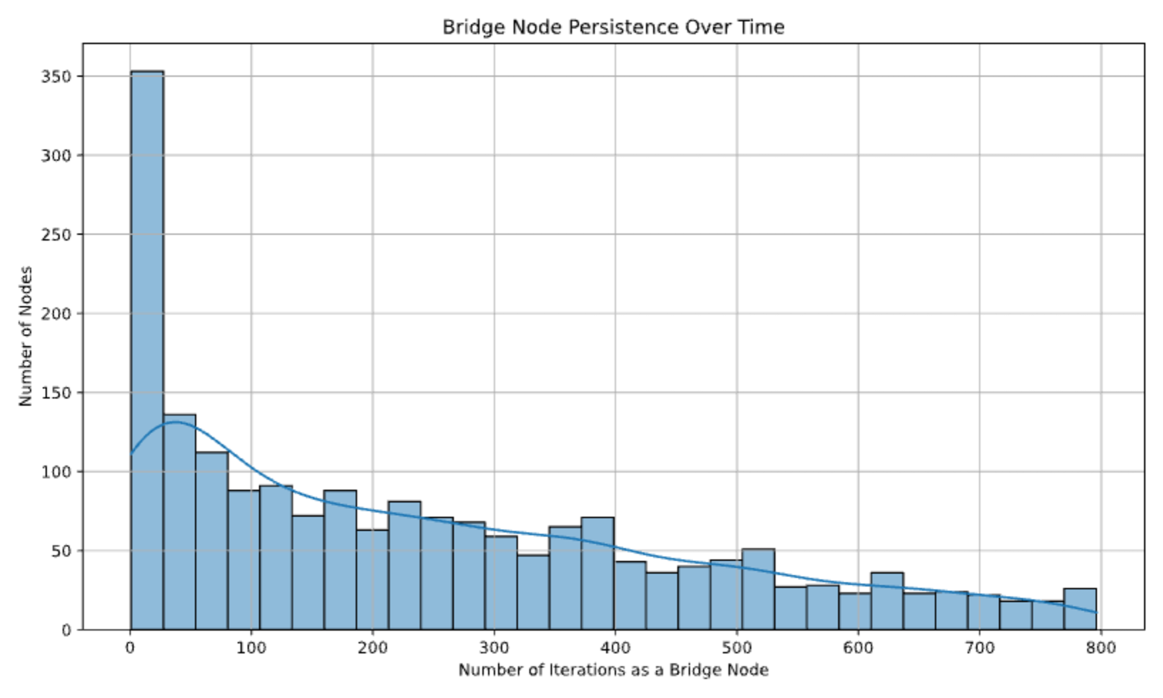
The chart visualizes the persistence of bridge nodes over time, measured by the number of iterations they function as bridge nodes. The y-axis represents the "Number of Nodes," while the x-axis represents "Number of Iterations as a Bridge Node." A blue trend line overlays the bar chart, indicating a general decline in node persistence as iterations increase.
### Components/Axes
- **Title**: "Bridge Node Persistence Over Time" (centered at the top).
- **X-Axis**: Labeled "Number of Iterations as a Bridge Node," with intervals marked at 0, 100, 200, ..., 800.
- **Y-Axis**: Labeled "Number of Nodes," with intervals marked at 0, 50, 100, ..., 350.
- **Bars**: Blue vertical bars representing node counts for each iteration range.
- **Trend Line**: A smooth blue curve overlaid on the bars, showing a declining pattern.
### Detailed Analysis
- **Initial Iterations (0–100)**:
- The tallest bar at 0 iterations shows approximately **350 nodes**.
- By 50 iterations, the count drops to ~140 nodes.
- At 100 iterations, the count stabilizes near ~110 nodes.
- **Mid-Range Iterations (100–400)**:
- Gradual decline continues: ~90 nodes at 150 iterations, ~70 nodes at 200 iterations, ~60 nodes at 300 iterations.
- A slight uptick occurs at ~400 iterations (~70 nodes), but this is followed by a sharp drop.
- **Later Iterations (400–800)**:
- Node counts decline steadily: ~50 nodes at 500 iterations, ~30 nodes at 600 iterations, ~20 nodes at 700 iterations, and ~20 nodes at 800 iterations.
- **Trend Line**: The blue line closely follows the bar heights, confirming the overall downward trend with minor fluctuations.
### Key Observations
1. **Steep Initial Decline**: The most significant drop occurs between 0 and 100 iterations (350 → 110 nodes).
2. **Mid-Range Stability**: Node counts stabilize between 100–400 iterations but remain below initial levels.
3. **Late-Stage Decline**: A consistent drop from 400 to 800 iterations, with no recovery.
4. **No Outliers**: All bars align with the trend line, indicating no anomalous data points.
### Interpretation
The data suggests that bridge nodes exhibit high persistence initially but degrade over time as they are used more frequently. The steep decline in the first 100 iterations implies that new nodes are highly persistent, but repeated use reduces their longevity. The gradual decline after 100 iterations indicates a stabilization phase, though persistence continues to erode. The late-stage drop (400–800 iterations) may reflect a critical threshold where nodes become unreliable or are replaced. This pattern highlights the need for periodic node rotation or maintenance to sustain network reliability.
**Note**: All values are approximate, derived from visual estimation of bar heights relative to the y-axis scale. The absence of a legend suggests the trend line is an implicit representation of the data’s central tendency.