## Histograms: Price and Duration Distribution of o1-Preview
### Overview
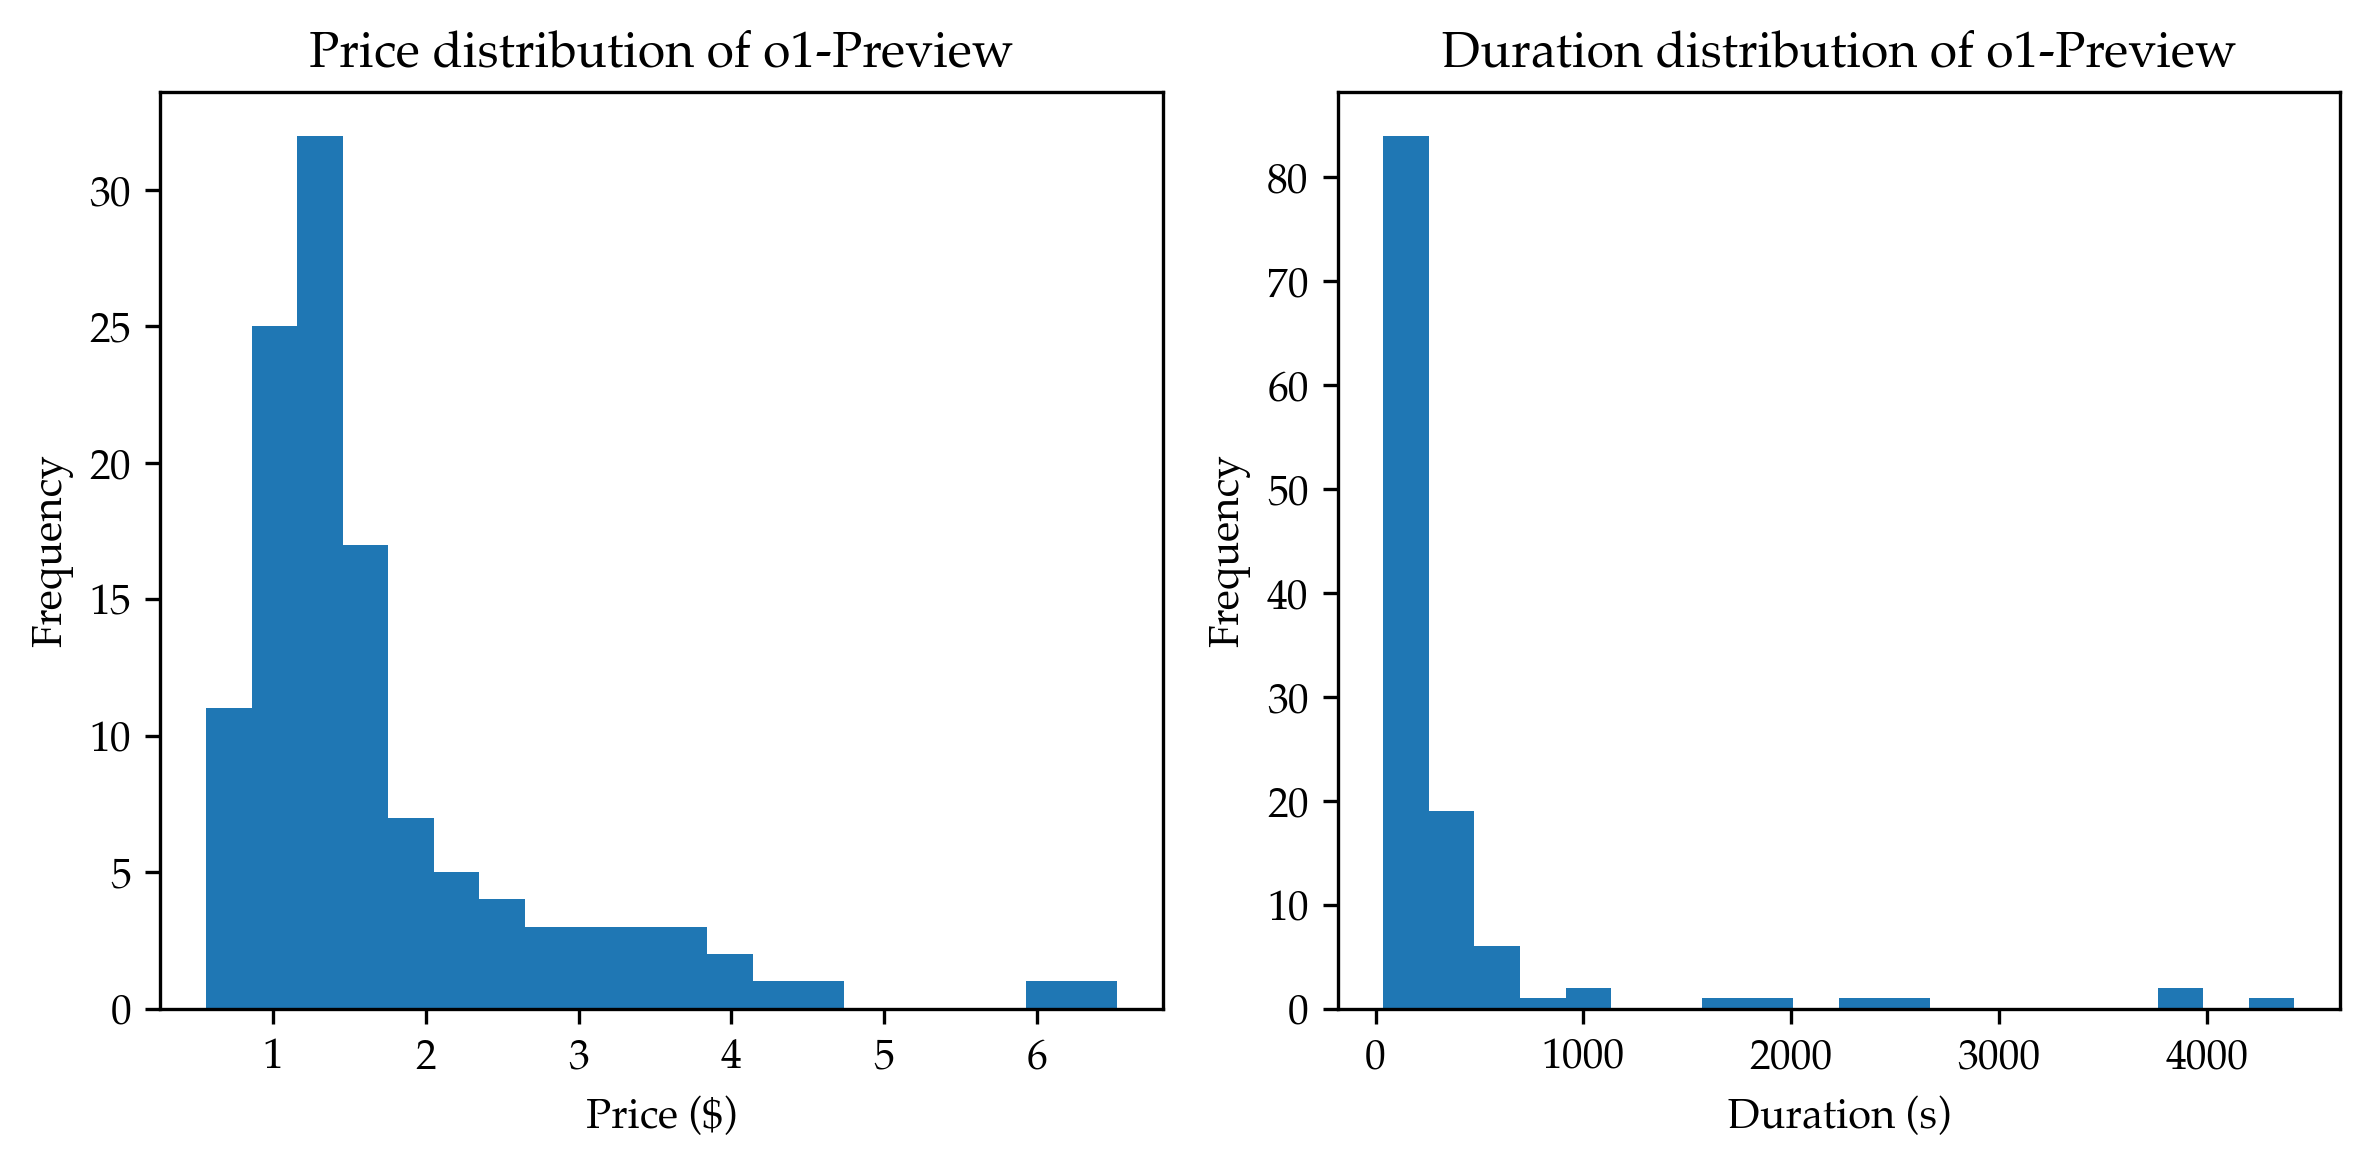
The image presents two histograms, side-by-side. The left histogram displays the price distribution of "o1-Preview", while the right histogram shows the duration distribution of the same. Both histograms use the same teal color for the bars.
### Components/Axes
**Left Histogram (Price Distribution):**
* **Title:** "Price distribution of o1-Preview" (top-center)
* **X-axis Label:** "Price ($)" (bottom-center)
* **Y-axis Label:** "Frequency" (left-center)
* **X-axis Range:** Approximately 0.8 to 6.2
* **Y-axis Range:** Approximately 0 to 32
**Right Histogram (Duration Distribution):**
* **Title:** "Duration distribution of o1-Preview" (top-center)
* **X-axis Label:** "Duration (s)" (bottom-center)
* **Y-axis Label:** "Frequency" (left-center)
* **X-axis Range:** Approximately 0 to 4000
* **Y-axis Range:** Approximately 0 to 80
### Detailed Analysis or Content Details
**Left Histogram (Price Distribution):**
The distribution is unimodal and skewed to the right. The highest frequency occurs around a price of approximately $1.8.
* **Bin 1 (0.8 - 1.2):** Frequency ≈ 28
* **Bin 2 (1.2 - 1.6):** Frequency ≈ 18
* **Bin 3 (1.6 - 2.0):** Frequency ≈ 16
* **Bin 4 (2.0 - 2.4):** Frequency ≈ 10
* **Bin 5 (2.4 - 2.8):** Frequency ≈ 6
* **Bin 6 (2.8 - 3.2):** Frequency ≈ 4
* **Bin 7 (3.2 - 3.6):** Frequency ≈ 2
* **Bin 8 (3.6 - 4.0):** Frequency ≈ 1
* **Bin 9 (4.0 - 4.4):** Frequency ≈ 1
* **Bin 10 (4.4 - 4.8):** Frequency ≈ 0
* **Bin 11 (4.8 - 5.2):** Frequency ≈ 1
* **Bin 12 (5.2 - 5.6):** Frequency ≈ 0
* **Bin 13 (5.6 - 6.0):** Frequency ≈ 0
**Right Histogram (Duration Distribution):**
The distribution is heavily skewed to the right. The highest frequency occurs near a duration of 0 seconds.
* **Bin 1 (0 - 200):** Frequency ≈ 72
* **Bin 2 (200 - 400):** Frequency ≈ 8
* **Bin 3 (400 - 600):** Frequency ≈ 3
* **Bin 4 (600 - 800):** Frequency ≈ 2
* **Bin 5 (800 - 1000):** Frequency ≈ 1
* **Bin 6 (1000 - 1200):** Frequency ≈ 1
* **Bin 7 (1200 - 1400):** Frequency ≈ 0
* **Bin 8 (1400 - 1600):** Frequency ≈ 0
* **Bin 9 (1600 - 1800):** Frequency ≈ 0
* **Bin 10 (1800 - 2000):** Frequency ≈ 0
* **Bin 11 (2000 - 2200):** Frequency ≈ 0
* **Bin 12 (2200 - 2400):** Frequency ≈ 0
* **Bin 13 (2400 - 2600):** Frequency ≈ 0
* **Bin 14 (2600 - 2800):** Frequency ≈ 0
* **Bin 15 (2800 - 3000):** Frequency ≈ 0
* **Bin 16 (3000 - 3200):** Frequency ≈ 0
* **Bin 17 (3200 - 3400):** Frequency ≈ 0
* **Bin 18 (3400 - 3600):** Frequency ≈ 0
* **Bin 19 (3600 - 3800):** Frequency ≈ 0
* **Bin 20 (3800 - 4000):** Frequency ≈ 0
### Key Observations
* The price distribution shows a concentration of items priced around $1.8, with a long tail extending to higher prices.
* The duration distribution is highly concentrated at very short durations (close to 0 seconds), with a very long tail extending to longer durations.
* The vast majority of "o1-Preview" items have a duration of less than 200 seconds.
### Interpretation
The data suggests that "o1-Preview" items are relatively inexpensive, with most falling below $3. However, there is a small number of items with significantly higher prices. The duration data indicates that most "o1-Preview" items are very short in duration, likely previews or short clips. The long tails in both distributions suggest the presence of outliers – a few items with very high prices and a few items with very long durations. This could indicate a variety of content types or pricing strategies within the "o1-Preview" collection. The extreme skewness in the duration distribution suggests that the majority of items are very brief, while a small number are substantially longer. This could be due to the nature of the content (e.g., short trailers vs. full-length videos).