## Histograms: Price and Duration Distributions of o1-Preview
### Overview
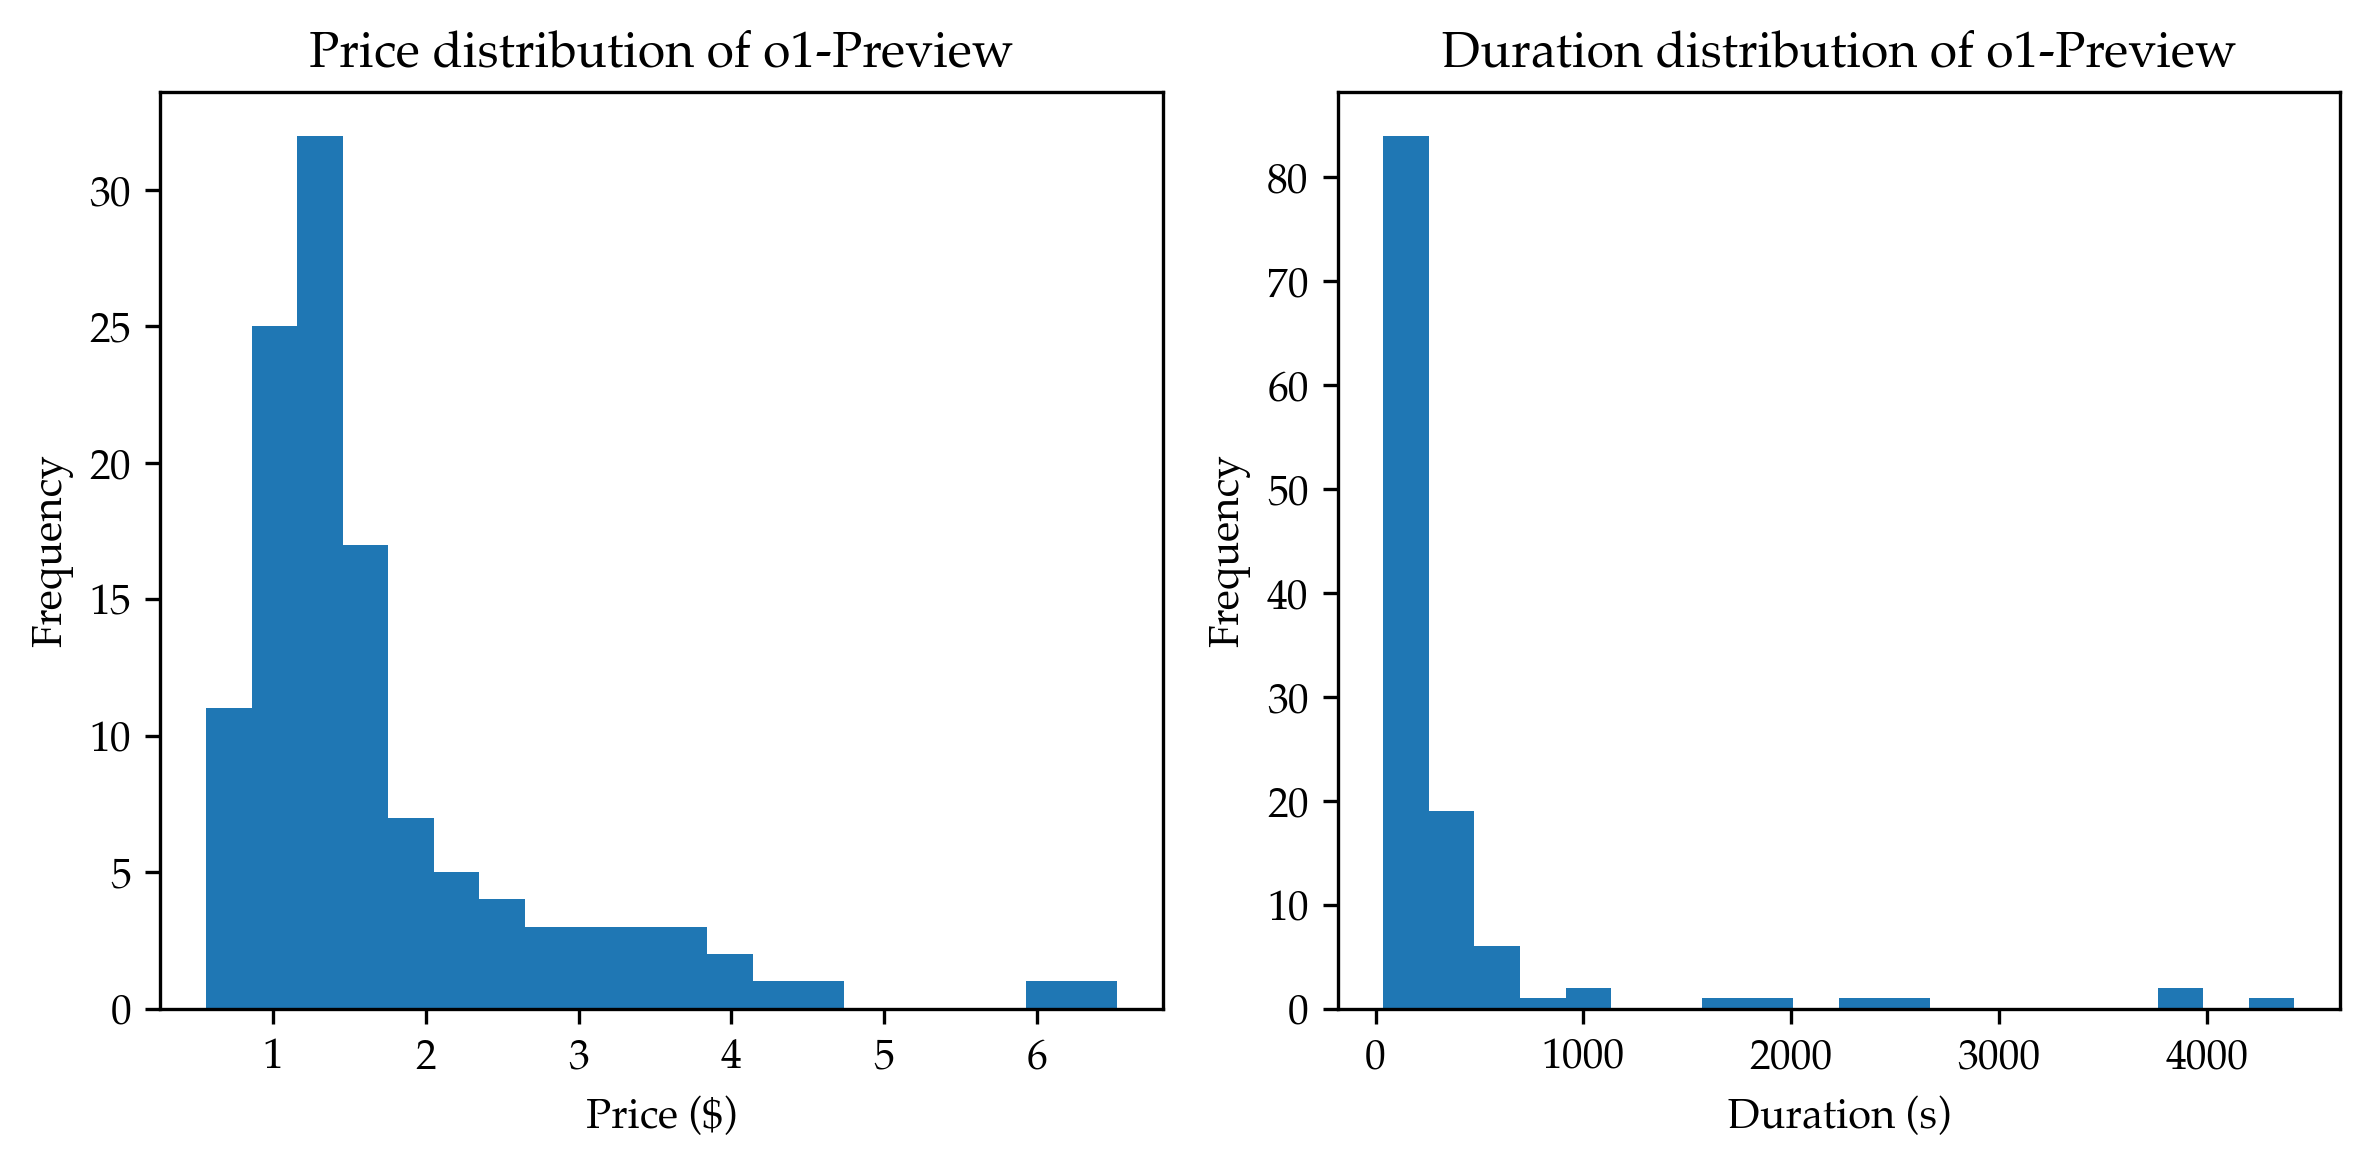
The image displays two side-by-side histograms visualizing the frequency distributions of two metrics for a subject labeled "o1-Preview": Price (in US Dollars) and Duration (in seconds). The charts are presented on a white background with black axes and titles. The data is represented by solid blue bars.
### Components/Axes
**Left Chart: Price Distribution**
* **Title:** "Price distribution of o1-Preview" (centered above the chart).
* **Y-axis:** Label is "Frequency". The scale runs from 0 to 30, with major tick marks at intervals of 5 (0, 5, 10, 15, 20, 25, 30).
* **X-axis:** Label is "Price ($)". The scale runs from approximately 0.5 to 6.5, with major tick marks labeled at 1, 2, 3, 4, 5, and 6.
* **Legend:** None present.
**Right Chart: Duration Distribution**
* **Title:** "Duration distribution of o1-Preview" (centered above the chart).
* **Y-axis:** Label is "Frequency". The scale runs from 0 to 80, with major tick marks at intervals of 10 (0, 10, 20, 30, 40, 50, 60, 70, 80).
* **X-axis:** Label is "Duration (s)". The scale runs from 0 to approximately 4500, with major tick marks labeled at 0, 1000, 2000, 3000, and 4000.
* **Legend:** None present.
### Detailed Analysis
**Price Distribution (Left Chart):**
* **Trend:** The distribution is strongly right-skewed (positively skewed). The highest frequency of occurrences is concentrated at the lower end of the price scale, with a long tail extending to higher prices.
* **Data Points (Approximate Frequencies per Bin):**
* Bin ~$0.50-$0.75: Frequency ≈ 11
* Bin ~$0.75-$1.00: Frequency ≈ 25
* **Peak Bin ~$1.00-$1.25: Frequency ≈ 32** (This is the mode of the distribution).
* Bin ~$1.25-$1.50: Frequency ≈ 17
* Bin ~$1.50-$1.75: Frequency ≈ 7
* Bin ~$1.75-$2.00: Frequency ≈ 5
* Bin ~$2.00-$2.25: Frequency ≈ 4
* Bin ~$2.25-$2.50: Frequency ≈ 3
* Bin ~$2.50-$2.75: Frequency ≈ 3
* Bin ~$2.75-$3.00: Frequency ≈ 3
* Bin ~$3.00-$3.25: Frequency ≈ 3
* Bin ~$3.25-$3.50: Frequency ≈ 2
* Bin ~$3.50-$3.75: Frequency ≈ 1
* Bin ~$3.75-$4.00: Frequency ≈ 1
* Bin ~$6.00-$6.25: Frequency ≈ 1 (This is an isolated outlier far from the main cluster).
**Duration Distribution (Right Chart):**
* **Trend:** The distribution is extremely right-skewed. The vast majority of durations are very short, clustered near zero seconds, with an exceptionally long and sparse tail extending to over 4000 seconds.
* **Data Points (Approximate Frequencies per Bin):**
* **Peak Bin ~0-250s: Frequency ≈ 84** (This is the overwhelming mode).
* Bin ~250-500s: Frequency ≈ 19
* Bin ~500-750s: Frequency ≈ 6
* Bin ~750-1000s: Frequency ≈ 1
* Bin ~1000-1250s: Frequency ≈ 2
* Bin ~1500-1750s: Frequency ≈ 1
* Bin ~2250-2500s: Frequency ≈ 1
* Bin ~3750-4000s: Frequency ≈ 2
* Bin ~4250-4500s: Frequency ≈ 1
### Key Observations
1. **Dominant Low-Value Clusters:** Both distributions are dominated by low values. For price, the mode is between $1.00-$1.25. For duration, the mode is between 0-250 seconds.
2. **Extreme Skewness:** The duration distribution is far more skewed than the price distribution. While price has a tail extending to ~$6.25, duration has a tail extending to ~4500 seconds, which is orders of magnitude larger than the modal value.
3. **Presence of Outliers:** Both charts show outliers. The price chart has a single instance near $6.25, isolated from the main data. The duration chart has several sparse instances beyond 1500 seconds, with the furthest near 4500 seconds.
4. **Frequency Scales:** The y-axis scales differ significantly. The price chart's maximum frequency is ~32, while the duration chart's maximum frequency is ~84, indicating a higher concentration of data points in the lowest duration bin.
### Interpretation
The data suggests that the "o1-Preview" entity (likely a model, service, or process) most commonly operates at a low cost (around $1) and completes its tasks very quickly (under 4 minutes). The strong right skew in both metrics indicates that while low-cost, fast operations are the norm, there is a non-trivial subset of instances that are significantly more expensive and/or time-consuming.
The extreme skew in duration is particularly noteworthy. It implies that the process has a "long tail" behavior: most runs are brief, but a small fraction can become very lengthy, potentially indicating complex edge cases, system hangs, or tasks requiring extensive computation. The isolated high-price outlier suggests a rare, high-cost event that may be an anomaly or a specific, resource-intensive use case.
From a business or operational perspective, this distribution pattern highlights that average cost and duration may be misleading metrics. The median would be a better measure of central tendency. Planning and resource allocation must account for the rare but impactful long-duration, high-cost instances to ensure system stability and accurate budgeting.