## Histograms: Price and Duration Distribution of o1-Preview
### Overview
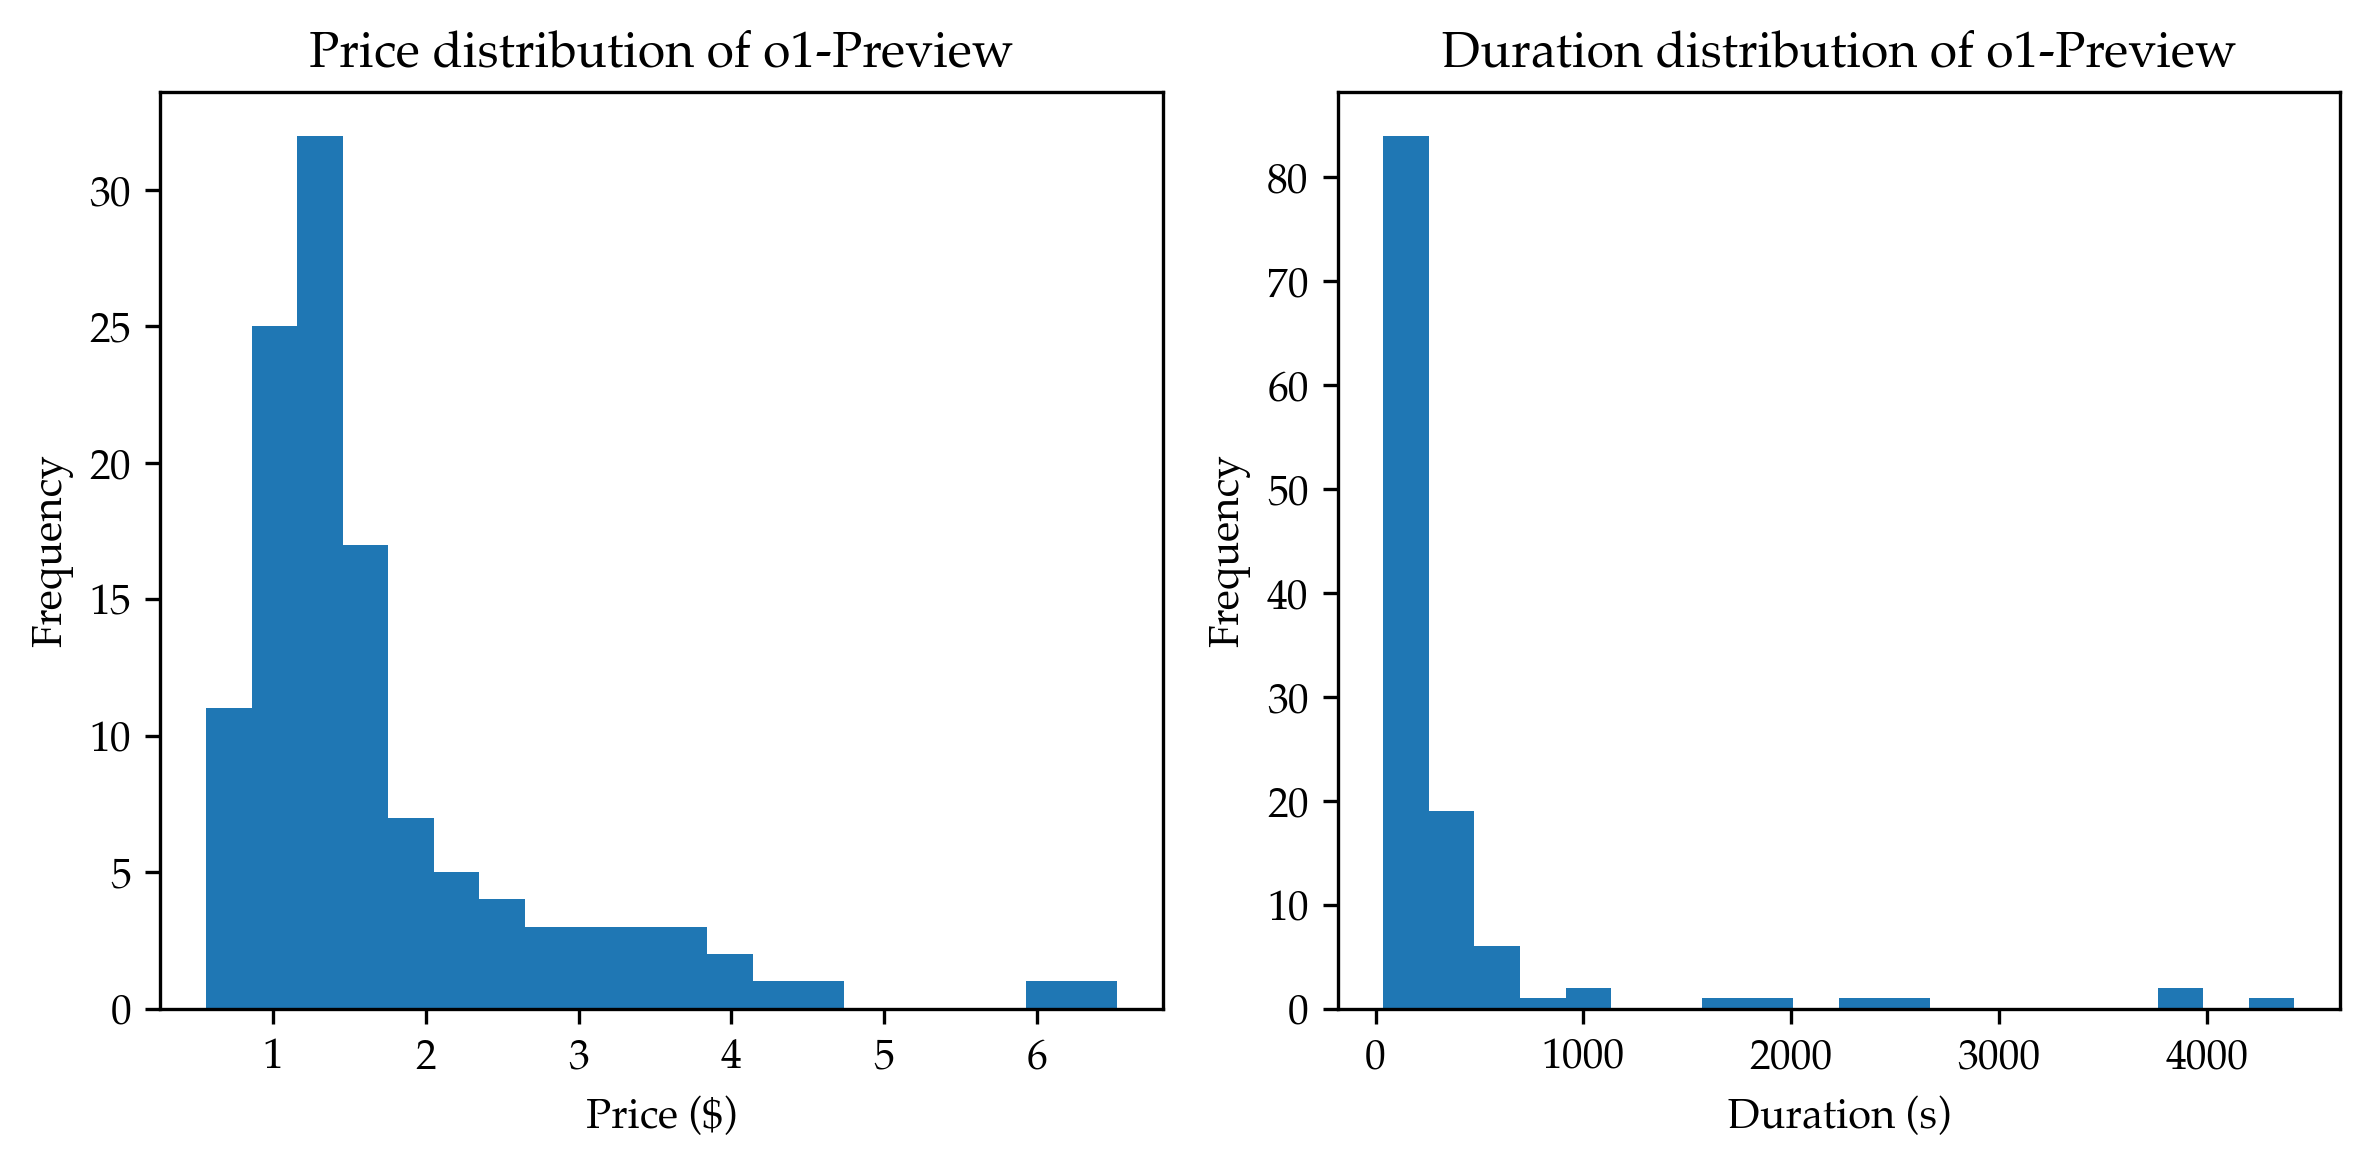
The image contains two adjacent histograms comparing the frequency distributions of two variables: **Price ($)** and **Duration (s)** for the o1-Preview system. Both histograms use blue bars to represent frequency counts.
---
### Components/Axes
#### Left Histogram (Price Distribution)
- **Title**: "Price distribution of o1-Preview"
- **X-axis**: "Price ($)" with bins spanning $0 to $6.
- **Y-axis**: "Frequency" with values from 0 to 30.
- **Bars**: Blue, with approximate frequencies:
- $1: ~30
- $2: ~15
- $3: ~5
- $4: ~3
- $5: ~1
- $6: ~1
#### Right Histogram (Duration Distribution)
- **Title**: "Duration distribution of o1-Preview"
- **X-axis**: "Duration (s)" with bins spanning 0 to 4000 seconds.
- **Y-axis**: "Frequency" with values from 0 to 80.
- **Bars**: Blue, with approximate frequencies:
- 0s: ~80
- 1000s: ~20
- 2000s: ~1
- 3000s: ~1
- 4000s: ~1
---
### Detailed Analysis
#### Price Distribution
- The distribution is **left-skewed**, with the highest frequency (~30) at $1.
- Frequencies decrease sharply as price increases, with no data points above $6.
- The majority of prices cluster between $1 and $3, suggesting affordability.
#### Duration Distribution
- The distribution is **extremely skewed**, with ~80 occurrences at 0 seconds.
- A secondary peak at ~1000 seconds (~20 frequency) indicates a small subset of longer durations.
- Durations beyond 1000 seconds are negligible (~1 each), suggesting rare or outlier events.
---
### Key Observations
1. **Price Affordability**: Most users pay $1, with prices above $2 being significantly less common.
2. **Duration Anomalies**:
- A massive concentration at 0 seconds implies many instances have no measurable duration (potential data artifacts or instantaneous interactions).
- The 1000-second peak may represent a specific use case or error in data collection.
3. **Outliers**: Durations beyond 1000 seconds are rare, with only ~3 instances total.
---
### Interpretation
- **Price Trends**: The o1-Preview system is designed to be cost-effective, with pricing concentrated at the lowest tier. This could reflect a freemium model or targeted affordability.
- **Duration Insights**:
- The 0-second peak suggests many interactions are either automated, failed, or not logged properly.
- The 1000-second cluster might indicate a specific task or user behavior (e.g., extended sessions for complex queries).
- The lack of data beyond 1000 seconds raises questions about data collection limits or user engagement patterns.
- **Anomalies**: The extreme skew in both distributions warrants further investigation into data quality and system usage.
---
### Final Notes
The histograms highlight a system optimized for low-cost, high-frequency interactions, with most users paying minimal fees and engaging briefly. However, the duration anomalies suggest potential gaps in data logging or edge cases requiring deeper analysis.