## Line Chart: Learning Rate Warmup Schedules
### Overview
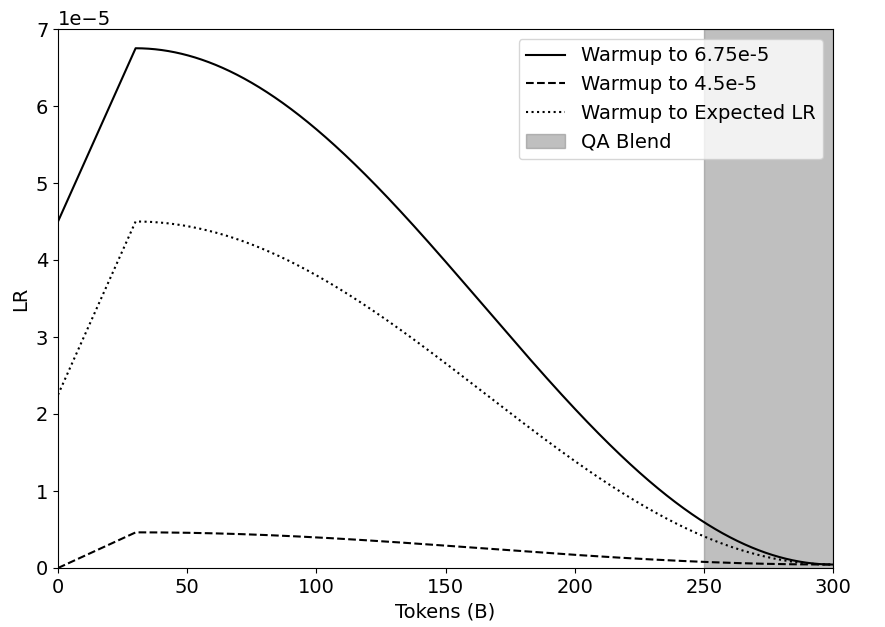
The image is a line chart illustrating three different learning rate (LR) warmup schedules, plotted against the number of tokens processed (in billions). It also shows a "QA Blend" region. The chart compares the learning rate curves for different warmup strategies.
### Components/Axes
* **X-axis:** "Tokens (B)" - Represents the number of tokens in billions, ranging from 0 to 300. Axis markers are present at intervals of 50 (0, 50, 100, 150, 200, 250, 300).
* **Y-axis:** "LR" - Represents the learning rate, scaled by 1e-5. The y-axis ranges from 0 to 7 (x 1e-5). Axis markers are present at intervals of 1 (1, 2, 3, 4, 5, 6, 7) (x 1e-5).
* **Legend:** Located in the top-right corner, it identifies the three learning rate schedules and the QA Blend region:
* Solid Black Line: "Warmup to 6.75e-5"
* Dashed Black Line: "Warmup to 4.5e-5"
* Dotted Black Line: "Warmup to Expected LR"
* Gray Rectangle: "QA Blend"
### Detailed Analysis
* **Warmup to 6.75e-5 (Solid Black Line):**
* Trend: Initially increases rapidly, peaks around 40 tokens, then gradually decreases.
* Data Points: Starts at approximately 4.5e-5 at 0 tokens, reaches a peak of approximately 6.75e-5 around 40 tokens, and decreases to approximately 0 at 300 tokens.
* **Warmup to 4.5e-5 (Dashed Black Line):**
* Trend: Increases rapidly initially, plateaus around 4.5e-5, and then gradually decreases.
* Data Points: Starts at 0 at 0 tokens, reaches a plateau of approximately 4.5e-5 around 40 tokens, and decreases to approximately 0 at 300 tokens.
* **Warmup to Expected LR (Dotted Black Line):**
* Trend: Increases rapidly initially, peaks around 4.5e-5, then gradually decreases.
* Data Points: Starts at approximately 2.25e-5 at 0 tokens, reaches a peak of approximately 4.5e-5 around 40 tokens, and decreases to approximately 0 at 300 tokens.
* **QA Blend (Gray Rectangle):**
* Position: A vertical rectangle spanning the entire y-axis, starting at approximately 250 tokens and ending at 300 tokens.
### Key Observations
* All three learning rate schedules start with a warmup phase, where the learning rate increases.
* The "Warmup to 6.75e-5" schedule reaches the highest learning rate.
* The "QA Blend" region indicates a phase where a quality assurance blending technique is applied.
* All learning rate schedules converge to approximately 0 at 300 tokens.
### Interpretation
The chart compares different learning rate warmup strategies for training a model, likely a large language model, based on the number of tokens processed. The "QA Blend" region suggests a phase where the model's output is blended with a quality assurance mechanism, potentially to improve the quality or safety of the generated text. The different warmup schedules likely aim to optimize the training process by gradually increasing the learning rate to avoid instability at the beginning of training. The convergence of all learning rates to zero at 300 tokens suggests the end of the training or a significant change in the training regime. The different peak learning rates and the shapes of the curves indicate different strategies for balancing exploration and exploitation during training.