## Line Chart: Learning Rate (LR) vs. Tokens
### Overview
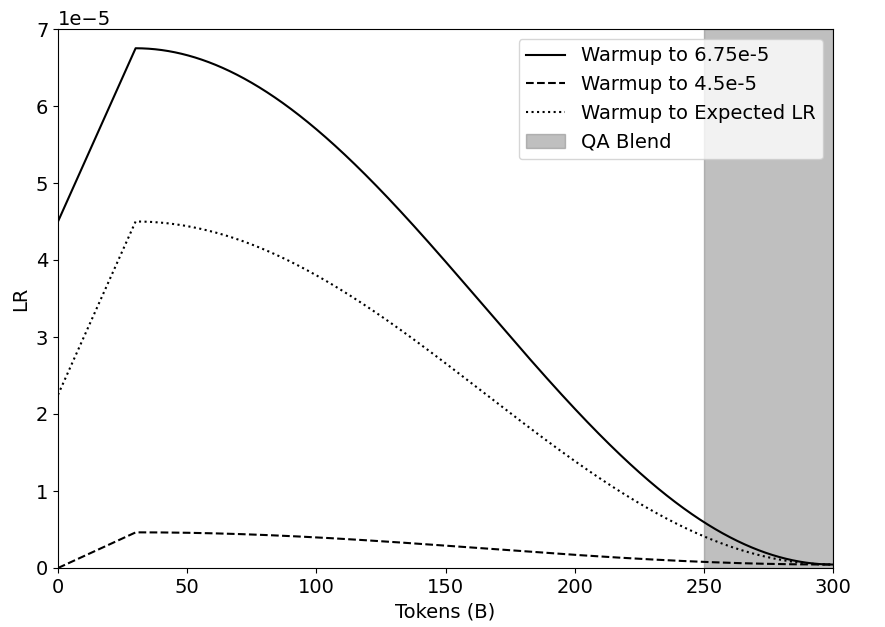
This image presents a line chart illustrating the relationship between Learning Rate (LR) and Tokens (in billions, denoted as 'B'). The chart displays three different learning rate warmup schedules and a shaded region representing a QA Blend. The x-axis represents the number of tokens (in billions), and the y-axis represents the learning rate.
### Components/Axes
* **X-axis:** Tokens (B) - Scale ranges from approximately 0 to 300.
* **Y-axis:** LR - Scale ranges from approximately 0 to 7e-5 (7 x 10^-5).
* **Legend:** Located in the top-right corner.
* "Warmup to 6.75e-5" - Solid black line.
* "Warmup to 4.5e-5" - Dashed black line.
* "Warmup to Expected LR" - Dotted black line.
* "QA Blend" - Light gray shaded region.
### Detailed Analysis
The chart shows three distinct learning rate warmup curves and a QA Blend region.
* **Warmup to 6.75e-5 (Solid Black Line):** This line starts at approximately 0 tokens with a learning rate of 0, rapidly increases to a peak of approximately 6.75e-5 at around 10 tokens, and then steadily decreases to approximately 0 at 275 tokens.
* **Warmup to 4.5e-5 (Dashed Black Line):** This line starts at 0 tokens with a learning rate of 0, increases to a peak of approximately 4.5e-5 at around 10 tokens, and then decreases more rapidly than the previous line, reaching approximately 0 at 225 tokens.
* **Warmup to Expected LR (Dotted Black Line):** This line starts at 0 tokens with a learning rate of 0, increases to a peak of approximately 4.5e-5 at around 50 tokens, and then decreases, reaching approximately 0 at 250 tokens.
* **QA Blend (Gray Shaded Region):** This region begins at approximately 250 tokens and extends to 300 tokens. It represents a blended learning rate, likely incorporating quality assurance considerations.
Here's a more detailed breakdown of approximate values:
| Tokens (B) | Warmup to 6.75e-5 | Warmup to 4.5e-5 | Warmup to Expected LR |
|---|---|---|---|
| 0 | 0 | 0 | 0 |
| 10 | 6.75e-5 | 4.5e-5 | ~1.5e-5 |
| 50 | ~6.0e-5 | ~3.5e-5 | 4.5e-5 |
| 100 | ~4.5e-5 | ~1.5e-5 | ~3.0e-5 |
| 150 | ~3.0e-5 | ~0.5e-5 | ~1.5e-5 |
| 200 | ~1.5e-5 | ~0 | ~0.5e-5 |
| 250 | ~0 | ~0 | ~0 |
| 300 | ~0 | ~0 | ~0 |
### Key Observations
* The "Warmup to 6.75e-5" line exhibits the slowest decay in learning rate.
* The "Warmup to 4.5e-5" line exhibits the fastest decay in learning rate.
* The "Warmup to Expected LR" line falls between the other two in terms of decay rate.
* The QA Blend region indicates a period where the learning rate is maintained at a low level, potentially for fine-tuning or quality assurance.
### Interpretation
This chart demonstrates different learning rate warmup strategies used during model training. The warmup phase gradually increases the learning rate from zero to a peak value, preventing instability at the beginning of training. The subsequent decay phase reduces the learning rate to fine-tune the model and avoid overfitting. The three lines represent different peak learning rates, allowing for experimentation to find the optimal value for a given task. The QA Blend region suggests a final stage of training focused on ensuring model quality and stability. The choice of warmup strategy and peak learning rate likely depends on the specific model architecture, dataset, and training objectives. The different decay rates suggest varying levels of aggressiveness in the learning rate reduction, potentially impacting the speed and quality of convergence.