## Line Chart: Learning Rate Schedules Over Training Tokens
### Overview
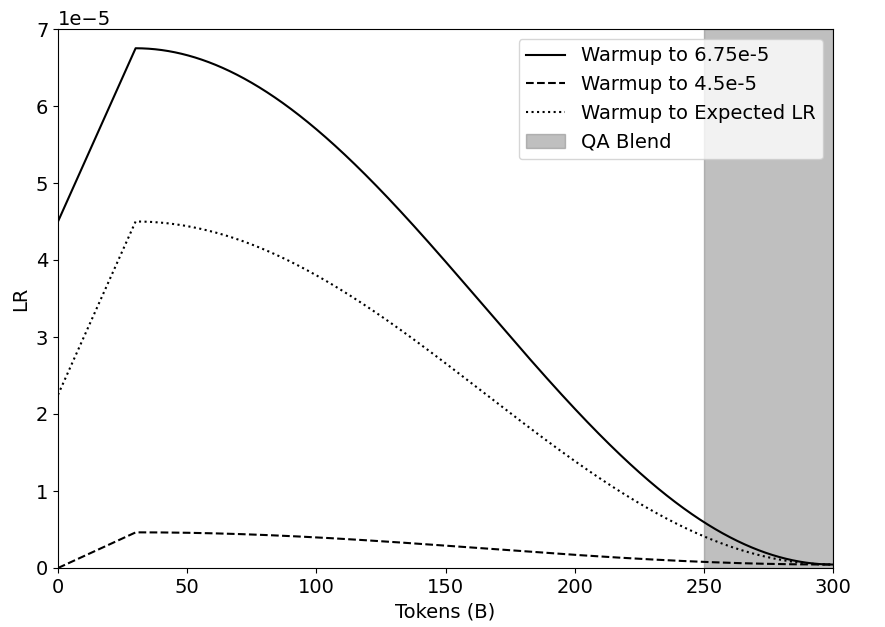
The image displays a line chart illustrating three different learning rate (LR) warmup schedules plotted against the number of training tokens (in billions). A shaded region indicates a "QA Blend" phase. The chart is designed to compare how the learning rate changes over the course of a model's training process under different warmup strategies.
### Components/Axes
* **X-Axis:** Labeled "Tokens (B)". It represents the number of training tokens in billions, with major tick marks at 0, 50, 100, 150, 200, 250, and 300.
* **Y-Axis:** Labeled "LR". It represents the learning rate value. The axis has a multiplier of `1e-5` noted at the top-left corner, meaning the displayed numbers (0 through 7) should be multiplied by 0.00001. Major tick marks are at 0, 1, 2, 3, 4, 5, 6, and 7.
* **Legend:** Positioned in the top-right corner of the plot area. It contains four entries:
1. **Solid Black Line:** "Warmup to 6.75e-5"
2. **Dashed Black Line:** "Warmup to 4.5e-5"
3. **Dotted Black Line:** "Warmup to Expected LR"
4. **Grey Shaded Area:** "QA Blend"
### Detailed Analysis
The chart plots three distinct learning rate trajectories. All schedules begin at 0 tokens with a non-zero LR, warm up to a peak, and then decay towards zero as training progresses.
**1. Warmup to 6.75e-5 (Solid Line):**
* **Trend:** This line shows the most aggressive warmup and the highest peak learning rate. It rises steeply, peaks early, and then follows a smooth, convex decay curve.
* **Key Data Points (Approximate):**
* Start (0B tokens): LR ≈ 4.5e-5
* Peak: Occurs at approximately 30B tokens, with a peak LR of ≈ 6.75e-5 (matching its label).
* Mid-point (150B tokens): LR ≈ 3.0e-5
* End (300B tokens): LR approaches 0.
**2. Warmup to Expected LR (Dotted Line):**
* **Trend:** This schedule has a moderate warmup and peak. Its decay curve is less steep than the solid line but follows a similar convex shape.
* **Key Data Points (Approximate):**
* Start (0B tokens): LR ≈ 2.3e-5
* Peak: Occurs at approximately 30B tokens, with a peak LR of ≈ 4.5e-5.
* Mid-point (150B tokens): LR ≈ 2.0e-5
* End (300B tokens): LR approaches 0.
**3. Warmup to 4.5e-5 (Dashed Line):**
* **Trend:** This is the most conservative schedule. It has a very shallow warmup to a low peak and a very gradual, nearly linear decay.
* **Key Data Points (Approximate):**
* Start (0B tokens): LR ≈ 0.
* Peak: Plateaus between approximately 30B and 70B tokens at a peak LR of ≈ 0.45e-5 (or 4.5e-6).
* Mid-point (150B tokens): LR ≈ 0.3e-5
* End (300B tokens): LR approaches 0.
**4. QA Blend (Grey Shaded Region):**
* **Position:** This vertical shaded area spans the x-axis from 250B tokens to 300B tokens.
* **Meaning:** It indicates a specific phase in the training process, likely where the data mixture is blended with Question-Answering (QA) data. All three LR schedules are in their final decay phase during this period.
### Key Observations
1. **Peak Timing:** All three schedules reach their peak learning rate at approximately the same point in training (~30B tokens).
2. **Hierarchy of Aggressiveness:** The schedules are clearly tiered: "Warmup to 6.75e-5" > "Warmup to Expected LR" > "Warmup to 4.5e-5" in terms of peak LR and overall magnitude throughout training.
3. **Convergence:** All three lines converge to near-zero learning rate by the end of training at 300B tokens.
4. **QA Blend Phase:** The final 50B tokens (from 250B to 300B) are designated as a QA Blend phase, during which the learning rate for all schedules is very low (< 1.0e-5).
### Interpretation
This chart visualizes different strategies for the critical "warmup" phase in training large language models. The warmup gradually increases the learning rate from a small value to a target peak to stabilize training.
* **The data suggests a trade-off:** The "Warmup to 6.75e-5" schedule represents a more aggressive approach, potentially leading to faster initial learning but carrying higher risk of instability. The "Warmup to 4.5e-5" schedule is a conservative, stable approach. The "Expected LR" schedule appears to be a middle-ground, possibly the default or theoretically derived target.
* **The relationship between elements** shows that regardless of the initial warmup target, the long-term decay schedule is designed to bring the learning rate down in a controlled manner as the model consumes more data (tokens). The QA Blend phase at the end suggests a fine-tuning or specialization stage using a specific dataset type, conducted at a very low learning rate to make precise adjustments without disrupting the already-learned representations.
* **A notable anomaly** is that the "Warmup to 4.5e-5" line starts at 0, while the other two start at a positive value. This could indicate a different warmup function (e.g., starting from zero vs. starting from a fraction of the peak). The chart effectively communicates that the choice of warmup target significantly impacts the learning rate profile throughout the entire training run.