## Line Graph: Learning Rate (LR) vs. Tokens (B) with Warmup Strategies and QA Blend Region
### Overview
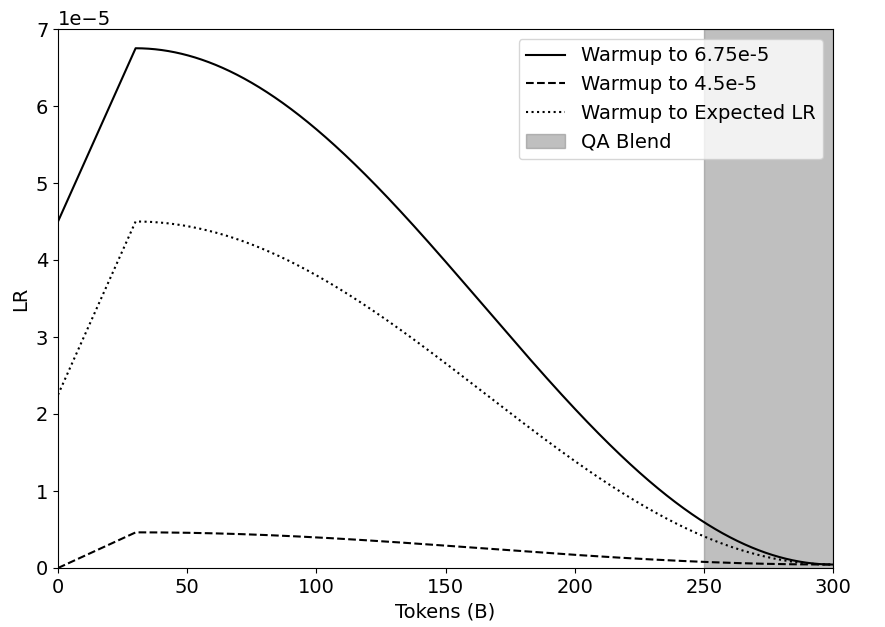
The graph illustrates the relationship between learning rate (LR) and token count (B) across three distinct warmup strategies and a QA Blend region. Three lines represent different warmup targets, with a shaded area marking the QA Blend phase. The y-axis (LR) ranges from 0 to 7e-5, while the x-axis (Tokens) spans 0 to 300.
### Components/Axes
- **X-axis (Tokens)**: Labeled "Tokens (B)", scaled from 0 to 300 in increments of 50.
- **Y-axis (LR)**: Labeled "LR", scaled logarithmically from 0 to 7e-5.
- **Legend**:
- Solid line: "Warmup to 6.75e-5"
- Dashed line: "Warmup to 4.5e-5"
- Dotted line: "Warmup to Expected LR"
- **Shaded Region**: Gray rectangle labeled "QA Blend" spanning tokens 250–300.
### Detailed Analysis
1. **Solid Line (Warmup to 6.75e-5)**:
- Peaks at **6.75e-5** near **50 tokens**.
- Declines sharply to near 0 by **300 tokens**.
- Steepest drop occurs between **50–150 tokens**.
2. **Dashed Line (Warmup to 4.5e-5)**:
- Peaks at **4.5e-5** near **50 tokens**.
- Declines gradually, remaining above 0.1e-5 until **250 tokens**.
- Flattens near 0.05e-5 between **200–300 tokens**.
3. **Dotted Line (Warmup to Expected LR)**:
- Peaks at **4e-5** near **50 tokens**.
- Declines more gradually than the dashed line, reaching ~0.1e-5 by **250 tokens**.
- Crosses the dashed line near **150 tokens**.
4. **Shaded Region (QA Blend)**:
- Occupies tokens **250–300**.
- All lines converge near 0 LR within this region.
### Key Observations
- All warmup strategies peak near **50 tokens**, with the solid line achieving the highest LR.
- The solid and dashed lines diverge significantly after **100 tokens**, with the solid line dropping faster.
- The dotted line exhibits the slowest decline, suggesting a more sustained LR.
- The QA Blend region coincides with the final phase of LR decay for all strategies.
### Interpretation
The graph demonstrates how varying warmup targets influence LR decay over token processing. The solid line (highest target) exhibits the most aggressive decay, likely reflecting a rapid adaptation phase. The dashed and dotted lines (lower targets) show more gradual decay, possibly indicating conservative warmup strategies. The QA Blend region may represent a transitional phase where the model integrates learned patterns, as all strategies converge to near-zero LR. The sharp drop in the solid line after 50 tokens suggests a potential over-adjustment risk, while the dotted line’s slower decay might align better with stable QA performance. The convergence in the QA Blend region implies that all strategies ultimately stabilize, though the solid line’s rapid decay could risk underfitting if not balanced.