## Line Chart: Final-round Accuracy vs. Noise
### Overview
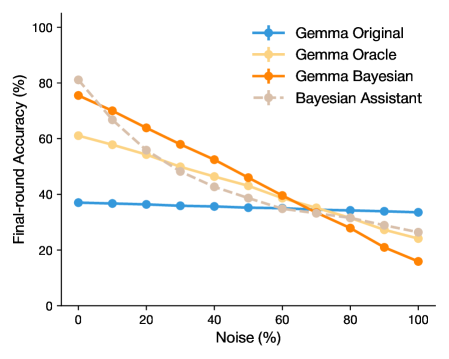
The image is a line chart comparing the final-round accuracy of four different models (Gemma Original, Gemma Oracle, Gemma Bayesian, and Bayesian Assistant) as the noise level increases from 0% to 100%. The chart shows how the accuracy of each model changes with increasing noise.
### Components/Axes
* **X-axis:** Noise (%), with markers at 0, 20, 40, 60, 80, and 100.
* **Y-axis:** Final-round Accuracy (%), with markers at 0, 20, 40, 60, 80, and 100.
* **Legend:** Located in the top-right corner, identifying each line by color and name:
* Blue: Gemma Original
* Light Orange: Gemma Oracle
* Orange: Gemma Bayesian
* Gray dashed: Bayesian Assistant
### Detailed Analysis
* **Gemma Original (Blue):** The line is nearly horizontal, indicating that the final-round accuracy remains relatively constant as noise increases. The accuracy is approximately 37% across all noise levels.
* At 0% Noise: ~37% Accuracy
* At 100% Noise: ~34% Accuracy
* **Gemma Oracle (Light Orange):** The line slopes downward, indicating that the final-round accuracy decreases as noise increases.
* At 0% Noise: ~61% Accuracy
* At 100% Noise: ~25% Accuracy
* **Gemma Bayesian (Orange):** The line slopes downward, indicating that the final-round accuracy decreases as noise increases.
* At 0% Noise: ~76% Accuracy
* At 100% Noise: ~16% Accuracy
* **Bayesian Assistant (Gray dashed):** The line slopes downward, indicating that the final-round accuracy decreases as noise increases.
* At 0% Noise: ~82% Accuracy
* At 100% Noise: ~27% Accuracy
### Key Observations
* Gemma Original maintains a stable accuracy regardless of noise level.
* Gemma Oracle, Gemma Bayesian, and Bayesian Assistant all experience a decrease in accuracy as noise increases.
* Bayesian Assistant has the highest initial accuracy (at 0% noise) but also experiences a significant drop as noise increases.
* Gemma Bayesian starts with a high accuracy but degrades to the lowest accuracy at 100% noise.
* At around 60% noise, the accuracy of Gemma Oracle, Gemma Bayesian, and Bayesian Assistant converge to approximately 35%.
### Interpretation
The chart demonstrates the robustness of the "Gemma Original" model to noise, as its accuracy remains relatively stable. In contrast, the other three models ("Gemma Oracle", "Gemma Bayesian", and "Bayesian Assistant") are more susceptible to noise, with their accuracy decreasing as noise levels increase. The "Bayesian Assistant" model, while initially having the highest accuracy, is the most affected by noise. This suggests that while some models may perform well in ideal conditions (low noise), their performance degrades significantly in noisy environments. The intersection of the lines around 60% noise indicates a point where the performance of the noise-sensitive models becomes comparable. The "Gemma Original" model's consistent performance might be preferable in applications where noise is expected.