\n
## Line Chart: Final-Round Accuracy vs. Noise Percentage
### Overview
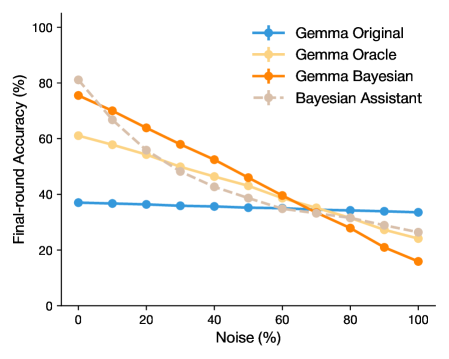
This line chart depicts the relationship between noise percentage and final-round accuracy for four different models: Gemma Original, Gemma Oracle, Gemma Bayesian, and Bayesian Assistant. The chart illustrates how each model's accuracy degrades as the level of noise increases.
### Components/Axes
* **X-axis:** Noise (%) - Ranges from 0% to 100%, with markers at 0, 20, 40, 60, 80, and 100.
* **Y-axis:** Final-round Accuracy (%) - Ranges from 0% to 100%, with markers at 0, 20, 40, 60, 80, and 100.
* **Legend:** Located in the top-right corner, identifying each line with a color and label:
* Gemma Original (Blue)
* Gemma Oracle (Yellow/Orange)
* Gemma Bayesian (Orange)
* Bayesian Assistant (Gray)
### Detailed Analysis
* **Gemma Original (Blue):** The line is relatively flat, indicating minimal change in accuracy with increasing noise.
* At 0% Noise: Approximately 38% Accuracy.
* At 20% Noise: Approximately 38% Accuracy.
* At 40% Noise: Approximately 38% Accuracy.
* At 60% Noise: Approximately 36% Accuracy.
* At 80% Noise: Approximately 34% Accuracy.
* At 100% Noise: Approximately 32% Accuracy.
* **Gemma Oracle (Yellow/Orange):** The line slopes downward, showing a decrease in accuracy as noise increases.
* At 0% Noise: Approximately 82% Accuracy.
* At 20% Noise: Approximately 72% Accuracy.
* At 40% Noise: Approximately 62% Accuracy.
* At 60% Noise: Approximately 52% Accuracy.
* At 80% Noise: Approximately 42% Accuracy.
* At 100% Noise: Approximately 32% Accuracy.
* **Gemma Bayesian (Orange):** The line exhibits a steeper downward slope than Gemma Oracle, indicating a more significant decrease in accuracy with increasing noise.
* At 0% Noise: Approximately 78% Accuracy.
* At 20% Noise: Approximately 68% Accuracy.
* At 40% Noise: Approximately 58% Accuracy.
* At 60% Noise: Approximately 48% Accuracy.
* At 80% Noise: Approximately 38% Accuracy.
* At 100% Noise: Approximately 20% Accuracy.
* **Bayesian Assistant (Gray):** The line is between Gemma Original and Gemma Oracle, showing a moderate decrease in accuracy with increasing noise.
* At 0% Noise: Approximately 62% Accuracy.
* At 20% Noise: Approximately 58% Accuracy.
* At 40% Noise: Approximately 52% Accuracy.
* At 60% Noise: Approximately 46% Accuracy.
* At 80% Noise: Approximately 38% Accuracy.
* At 100% Noise: Approximately 30% Accuracy.
### Key Observations
* Gemma Original demonstrates the most robust performance, maintaining a relatively stable accuracy level across all noise percentages.
* Gemma Bayesian is the most sensitive to noise, experiencing the largest drop in accuracy as noise increases.
* Gemma Oracle and Bayesian Assistant fall between these two extremes, exhibiting moderate sensitivity to noise.
* All models show a decline in accuracy as noise increases, but the rate of decline varies significantly.
### Interpretation
The chart suggests that Gemma Original is the most resilient model to noisy data, while Gemma Bayesian is the most vulnerable. This could be due to differences in the models' architectures or training methodologies. The data indicates that the Bayesian approach, while potentially offering higher accuracy in clean environments (as seen at 0% noise), suffers significantly when exposed to noise. The relatively stable performance of Gemma Original suggests it may be a more reliable choice for applications where data quality is uncertain. The consistent downward trend across all models highlights the general principle that noise negatively impacts the accuracy of machine learning models. The differences in the slopes of the lines reveal the varying degrees of robustness among the models. The chart provides valuable insights into the trade-offs between accuracy and robustness in these different models.