\n
## Bar Chart: R1-Llama | GPQA-D Word Ratio
### Overview
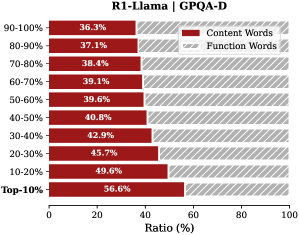
This is a horizontal bar chart displaying the ratio of "Content Words" to "Function Words" across different percentage ranges. The chart appears to analyze the composition of language used by the R1-Llama model on the GPQA-D dataset. The x-axis represents the ratio in percentage, and the y-axis represents the percentage ranges of words.
### Components/Axes
* **Title:** R1-Llama | GPQA-D
* **X-axis Label:** Ratio (%)
* **Y-axis:** Percentage ranges: Top >10%, 10-20%, 20-30%, 30-40%, 40-50%, 50-60%, 60-70%, 70-80%, 80-90%, 90-100%
* **Legend:**
* Content Words (Dark Red)
* Function Words (Light Gray)
### Detailed Analysis
The chart consists of two sets of horizontal bars for each percentage range. The dark red bars represent the ratio of Content Words, and the light gray bars represent the ratio of Function Words.
Here's a breakdown of the data points, reading from top to bottom:
* **90-100%:** Content Words: 36.3%, Function Words: ~63.7% (estimated)
* **80-90%:** Content Words: 37.1%, Function Words: ~62.9% (estimated)
* **70-80%:** Content Words: 38.4%, Function Words: ~61.6% (estimated)
* **60-70%:** Content Words: 39.1%, Function Words: ~60.9% (estimated)
* **50-60%:** Content Words: 39.6%, Function Words: ~60.4% (estimated)
* **40-50%:** Content Words: 40.8%, Function Words: ~59.2% (estimated)
* **30-40%:** Content Words: 42.9%, Function Words: ~57.1% (estimated)
* **20-30%:** Content Words: 45.7%, Function Words: ~54.3% (estimated)
* **10-20%:** Content Words: 49.6%, Function Words: ~50.4% (estimated)
* **Top >10%:** Content Words: 56.6%, Function Words: ~43.4% (estimated)
The Content Words bars generally increase in length as the percentage range decreases, indicating a higher ratio of content words in the top 10% of words. Conversely, the Function Words bars decrease in length as the percentage range decreases.
### Key Observations
* The ratio of Content Words is highest in the "Top >10%" range (56.6%) and lowest in the "90-100%" range (36.3%).
* The difference between the Content Word and Function Word ratios is most pronounced in the "Top >10%" range.
* The trend shows a gradual increase in the ratio of Content Words as you move from higher to lower percentage ranges.
### Interpretation
The data suggests that the R1-Llama model, when evaluated on the GPQA-D dataset, utilizes a higher proportion of content words in the most frequently occurring words (top 10%) compared to the less frequent words (90-100%). This could indicate that the model relies heavily on core vocabulary and concepts when generating responses or processing information. The consistent increase in content word ratio as the percentage range decreases suggests a hierarchical structure in word usage, where the most important words carry more semantic weight. The relatively stable ratio of function words across all ranges indicates that these words are essential for grammatical structure and are used consistently regardless of word frequency. This analysis provides insight into the linguistic characteristics of the R1-Llama model and its performance on the GPQA-D dataset.