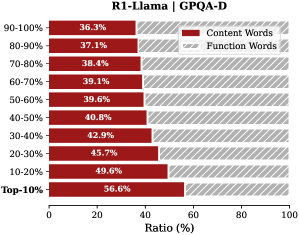
## Bar Chart: R1-Llama | GPQA-D
### Overview
The chart compares the distribution of **Content Words** (red) and **Function Words** (gray with diagonal stripes) across different percentile ranges of a dataset. The x-axis represents the ratio (%) of each word type, while the y-axis categorizes data into percentile brackets (e.g., 90-100%, 80-90%, ..., Top-10%). Each bar shows the proportion of Content Words (left) and Function Words (right) within each percentile range.
### Components/Axes
- **Title**: "R1-Llama | GPQA-D" (top center).
- **X-Axis**: Labeled "Ratio (%)" with a scale from 0 to 100.
- **Y-Axis**: Categorized into percentile ranges:
- 90-100%
- 80-90%
- 70-80%
- 60-70%
- 50-60%
- 40-50%
- 30-40%
- 20-30%
- 10-20%
- Top-10%
- **Legend**: Located in the top-right corner, with:
- **Red**: Content Words
- **Gray (diagonal stripes)**: Function Words
### Detailed Analysis
- **Content Words (Red)**:
- 90-100%: 36.3%
- 80-90%: 37.1%
- 70-80%: 38.4%
- 60-70%: 39.1%
- 50-60%: 39.6%
- 40-50%: 40.8%
- 30-40%: 42.9%
- 20-30%: 45.7%
- 10-20%: 49.6%
- Top-10%: 56.6%
- **Function Words (Gray)**:
- Calculated as 100% minus Content Words for each category (e.g., 90-100%: 63.7%, 80-90%: 62.9%, etc.).
### Key Observations
1. **Content Words Increase Gradually**: Content Words rise steadily from 36.3% (90-100%) to 56.6% (Top-10%), indicating a higher proportion of substantive terms in higher-ranked content.
2. **Function Words Decrease Gradually**: Function Words decline from 63.7% (90-100%) to 43.4% (Top-10%), suggesting less reliance on structural terms in top-ranked content.
3. **Steepest Growth in Top-10%**: The largest jump in Content Words occurs between 10-20% (49.6%) and Top-10% (56.6%), highlighting a concentration of meaningful content in the highest-ranked tier.
### Interpretation
The data suggests that higher-ranked content (e.g., Top-10%) contains a greater proportion of **Content Words** (e.g., nouns, verbs, adjectives) relative to **Function Words** (e.g., prepositions, conjunctions). This implies that top-tier content is more direct and information-dense, while lower-ranked content relies more on structural language. The trend aligns with expectations for relevance, as higher-ranked content likely prioritizes clarity and specificity over grammatical complexity. The steep increase in the Top-10% bracket may indicate a threshold effect, where the most critical information is concentrated in a smaller subset of the data.