## Scatter Plot: Accuracy vs. Time-to-Answer
### Overview
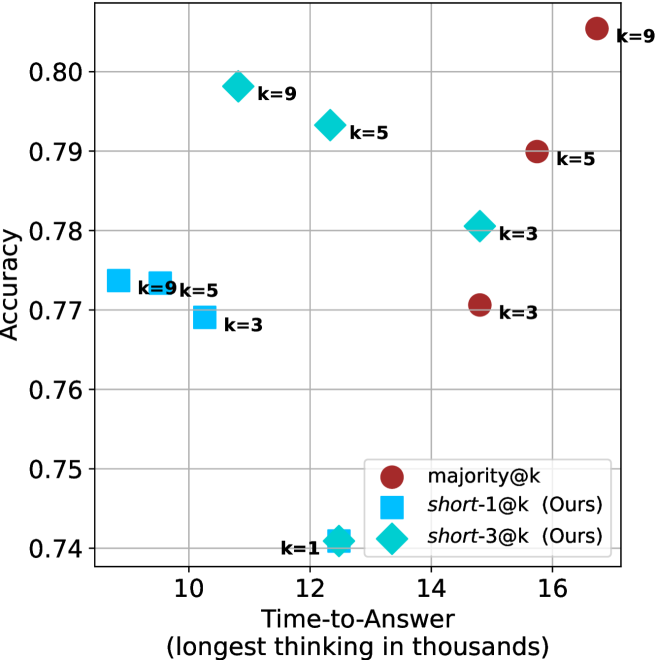
This image presents a scatter plot comparing the accuracy and time-to-answer for three different methods: majority@k, short-1@k (labeled "Ours"), and short-3@k (labeled "Ours"). The performance is evaluated for different values of 'k' (1, 3, 5, and 9). The plot visualizes the trade-off between accuracy and speed for each method and 'k' value.
### Components/Axes
* **X-axis:** Time-to-Answer (longest thinking in thousands) - Scale ranges from approximately 10 to 17.
* **Y-axis:** Accuracy - Scale ranges from approximately 0.74 to 0.81.
* **Legend:** Located in the bottom-center of the plot.
* Red circles: majority@k
* Blue squares: short-1@k (Ours)
* Cyan diamonds: short-3@k (Ours)
* **Labels:** Each data point is labeled with its corresponding 'k' value (k=1, k=3, k=5, k=9).
### Detailed Analysis
Let's analyze each data series and their trends:
**1. majority@k (Red Circles):**
* Trend: Generally, as 'k' increases, accuracy increases, but time-to-answer also increases.
* Data Points:
* k=1: Approximately (10.5, 0.75)
* k=3: Approximately (11.5, 0.77)
* k=5: Approximately (13.5, 0.79)
* k=9: Approximately (16.5, 0.80)
**2. short-1@k (Blue Squares - "Ours"):**
* Trend: Accuracy is relatively stable, while time-to-answer increases with 'k'.
* Data Points:
* k=1: Approximately (10.5, 0.74)
* k=3: Approximately (11.5, 0.77)
* k=5: Approximately (12.5, 0.79)
* k=9: Approximately (13.5, 0.79)
**3. short-3@k (Cyan Diamonds - "Ours"):**
* Trend: Accuracy increases with 'k', but the increase is less pronounced than for majority@k. Time-to-answer also increases with 'k'.
* Data Points:
* k=1: Approximately (11, 0.74)
* k=3: Approximately (12, 0.78)
* k=5: Approximately (13, 0.79)
* k=9: Approximately (14, 0.80)
### Key Observations
* For k=1, short-1@k has the lowest accuracy.
* For k=9, majority@k achieves the highest accuracy.
* short-3@k consistently outperforms short-1@k in terms of accuracy.
* The "Ours" methods (short-1@k and short-3@k) generally have lower accuracy than majority@k, but potentially faster response times, especially for smaller values of 'k'.
* The difference in accuracy between the methods diminishes as 'k' increases.
### Interpretation
The data suggests a trade-off between accuracy and time-to-answer. The majority@k method prioritizes accuracy, achieving the highest values at the cost of increased processing time. The "Ours" methods (short-1@k and short-3@k) aim for a balance, offering faster response times with a slight reduction in accuracy.
The choice of method and 'k' value depends on the specific application requirements. If accuracy is paramount, majority@k with a larger 'k' is preferred. If speed is critical, short-1@k or short-3@k with a smaller 'k' might be more suitable.
The consistent improvement of short-3@k over short-1@k indicates that increasing the number of considered candidates (from 1 to 3) improves the accuracy of the method. The diminishing returns in accuracy as 'k' increases suggest that there's a point beyond which increasing 'k' provides minimal benefit.
The plot effectively demonstrates the performance characteristics of different methods for a given task, allowing for informed decision-making based on the desired balance between accuracy and speed.