TECHNICAL ASSET FINGERPRINT
50d19c827ad7c66f5f4e4275
Click to view fullscreen
Press ESC or click to close
FOUND IN PAPERS
EXPERT: healer-alpha-free VERSION 1
RUNTIME: free/openrouter/healer-alpha
INTEL_VERIFIED
## Diagram: Machine Learning Model Taxonomy and Trade-offs
### Overview
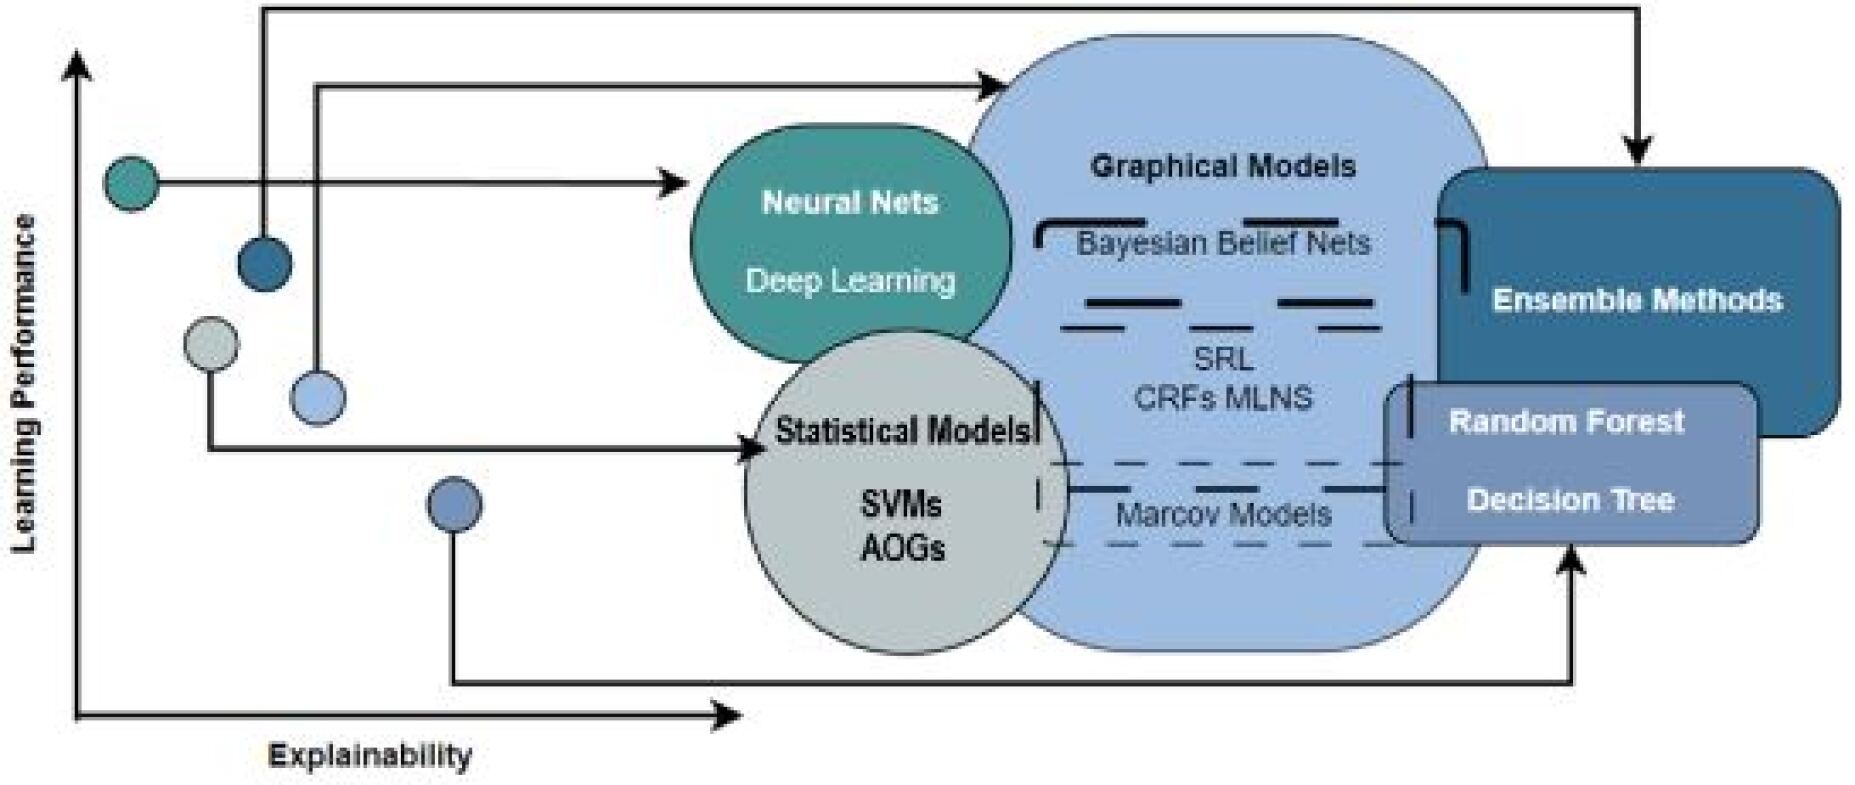
This image is a conceptual diagram illustrating the relationships between different families of machine learning models, plotted against two axes: "Learning Performance" (vertical) and "Explainability" (horizontal). It uses a combination of a scatter plot (left side) and overlapping, labeled regions (right side) connected by arrows to map abstract data points to model categories. The diagram visually communicates the trade-off between model power and interpretability.
### Components/Axes
* **Axes:**
* **Vertical Axis (Y-axis):** Labeled "Learning Performance". An arrow points upward, indicating increasing performance.
* **Horizontal Axis (X-axis):** Labeled "Explainability". An arrow points to the right, indicating increasing explainability.
* **Left Side - Data Points:** Five unlabeled circles of varying colors and shades are plotted in the 2D space defined by the axes. Their positions suggest different combinations of performance and explainability.
* Top-left (teal circle): High performance, low explainability.
* Upper-middle (dark blue circle): Moderately high performance, low-to-moderate explainability.
* Middle-left (light grey circle): Moderate performance, low explainability.
* Lower-middle (light blue circle): Moderate performance, moderate explainability.
* Bottom-center (medium blue circle): Lower performance, moderate explainability.
* **Right Side - Model Families (Labeled Regions):** Four major, overlapping regions represent model families.
1. **Neural Nets / Deep Learning:** A teal circle in the upper-left quadrant (high performance, low explainability).
2. **Statistical Models:** A light grey circle in the lower-left quadrant (moderate performance, low-to-moderate explainability). Contains sub-labels: **SVMs** (Support Vector Machines) and **AOGs** (And-Or Graphs).
3. **Graphical Models:** A large, light blue, irregular shape spanning the center. It overlaps with Statistical Models and Ensemble Methods. Contains sub-labels: **Bayesian Belief Nets**, **SRL** (Statistical Relational Learning), **CRFs** (Conditional Random Fields), **MLNs** (Markov Logic Networks), and **Markov Models**.
4. **Ensemble Methods:** A dark blue, rounded rectangle in the upper-right quadrant (high performance, moderate-to-high explainability). Overlaps with Graphical Models. Contains a sub-region labeled **Random Forest** and **Decision Tree**.
* **Connections (Arrows):** Black arrows connect the data points on the left to specific model family regions on the right.
* The top-left (teal) circle points to "Neural Nets / Deep Learning".
* The upper-middle (dark blue) circle points to "Ensemble Methods".
* The middle-left (light grey) circle points to "Statistical Models".
* The lower-middle (light blue) circle points to the overlapping area of "Graphical Models".
* The bottom-center (medium blue) circle points to the "Random Forest / Decision Tree" sub-region within "Ensemble Methods".
### Detailed Analysis
The diagram is a qualitative, not quantitative, representation. No numerical values are provided on the axes. The analysis is based on relative positioning and connections.
* **Spatial Grounding & Trend Verification:**
* **Neural Nets/Deep Learning:** Positioned highest on the "Learning Performance" axis and furthest left on the "Explainability" axis. This visually asserts they offer top performance but are the least interpretable.
* **Ensemble Methods:** Positioned high on performance and further right on explainability than Neural Nets, suggesting a better balance. The "Random Forest / Decision Tree" sub-region is placed slightly lower in performance but higher in explainability than the main "Ensemble Methods" block.
* **Statistical Models:** Positioned lower on performance than Neural Nets and Ensembles, but higher on explainability than Neural Nets.
* **Graphical Models:** Occupies a central, bridging position. It overlaps with Statistical Models (suggesting shared characteristics) and Ensemble Methods. Its placement suggests a balance between performance and explainability, potentially leaning towards higher explainability.
* **Component Isolation:**
* **Header/Context:** The axes define the conceptual framework.
* **Main Chart Area:** Contains the plotted circles and model family regions.
* **Footer/Labels:** All text is embedded within the main chart area.
### Key Observations
1. **Performance-Explainability Trade-off:** The core message is the inverse relationship between learning performance and explainability. The highest-performing models (Neural Nets) are the least explainable, while models with higher explainability (like Decision Trees) may sacrifice some performance.
2. **Model Overlap:** The significant overlap between "Graphical Models" and other families indicates that these categories are not mutually exclusive. Many real-world models hybridize approaches.
3. **Specific Model Placement:** "Random Forest" and "Decision Tree" are explicitly called out as a sub-component of "Ensemble Methods," highlighting their importance and specific trade-off profile within that family.
4. **Mapping Abstraction to Categories:** The arrows suggest that different problem types or data characteristics (represented by the abstract circles) are best suited to different model families. For instance, a problem requiring maximum performance (top-left circle) maps to Deep Learning.
### Interpretation
This diagram serves as a high-level guide for selecting machine learning approaches based on project priorities. It argues that there is no single "best" model family; the choice depends on the required balance between predictive power and the need for interpretability.
* **For critical applications where understanding the "why" is essential** (e.g., healthcare, finance, legal), models from the "Statistical Models," "Graphical Models," or the "Decision Tree" part of Ensemble Methods are suggested, as they reside further right on the Explainability axis.
* **For applications where raw predictive accuracy is paramount and interpretability is secondary** (e.g., image recognition, recommendation systems), "Neural Nets / Deep Learning" are indicated.
* **"Ensemble Methods" like Random Forests** are presented as a powerful compromise, offering high performance with relatively good explainability.
* The overlapping regions encourage a nuanced view, suggesting that advanced techniques often blend elements from multiple paradigms (e.g., Bayesian deep learning combines Neural Nets and Graphical Models).
The diagram effectively communicates that model selection is a strategic decision involving trade-offs, and it provides a visual map to navigate those trade-offs between the twin goals of performance and transparency.
DECODING INTELLIGENCE...