\n
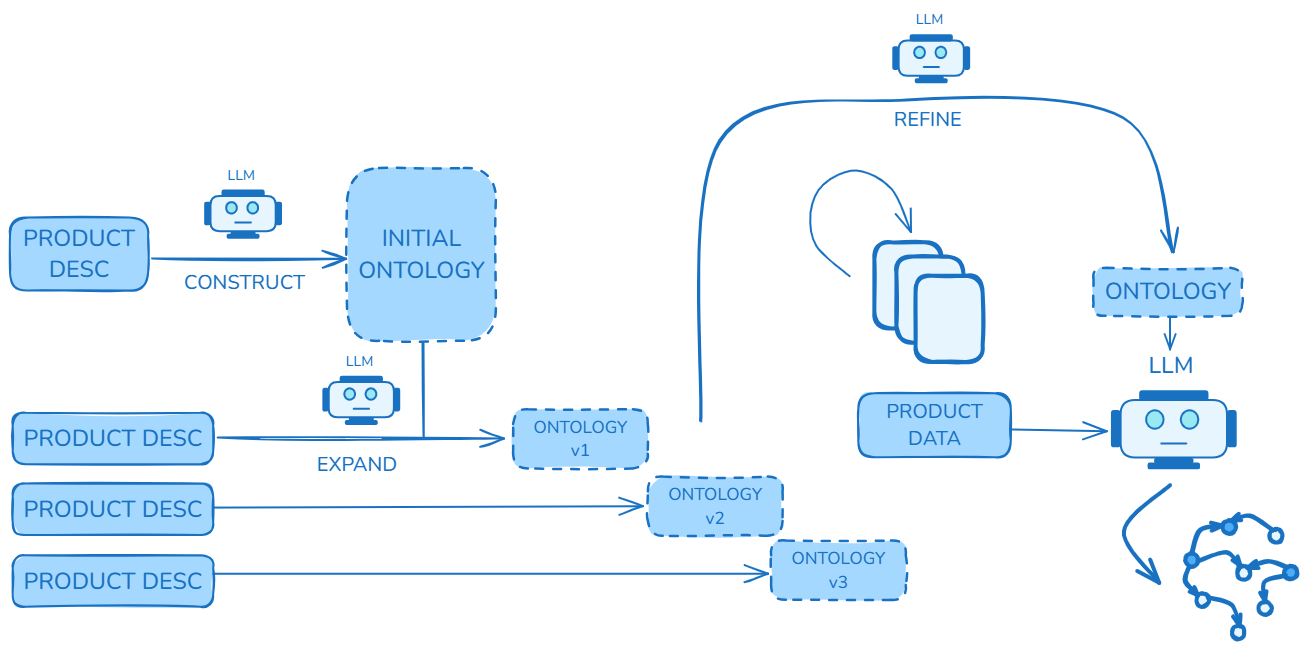
## Diagram: LLM-Powered Ontology Construction and Refinement Pipeline
### Overview
The image is a technical flowchart illustrating a multi-stage process for constructing, expanding, and refining an ontology using Large Language Models (LLMs). The process begins with product descriptions and iteratively builds and improves a structured knowledge representation (ontology), which is then applied to product data to generate a network graph. The diagram is divided into two primary sections: a left-hand side focused on initial construction and expansion, and a right-hand side focused on refinement and application.
### Components/Axes
The diagram consists of the following labeled components, connected by directional arrows indicating data or process flow:
**Left Section (Construction & Expansion):**
* **Input Nodes:** Four identical blue rounded rectangles labeled `PRODUCT DESC`.
* **Processing Nodes:** Three blue robot-head icons, each labeled `LLM`.
* **Process Labels:** Text labels on arrows: `CONSTRUCT` and `EXPAND`.
* **Output/State Nodes:**
* A large, dashed-border blue rectangle labeled `INITIAL ONTOLOGY`.
* Three smaller, dashed-border blue rectangles labeled `ONTOLOGY v1`, `ONTOLOGY v2`, and `ONTOLOGY v3`.
**Right Section (Refinement & Application):**
* **Input/State Node:** A blue rounded rectangle labeled `PRODUCT DATA`.
* **Processing Nodes:**
* A blue robot-head icon labeled `LLM` at the top.
* A stack of three document icons.
* A blue robot-head icon on the right.
* **Process Labels:** Text labels on arrows: `REFINE`.
* **State/Output Nodes:**
* A dashed-border blue rectangle labeled `ONTOLOGY`.
* A network graph icon (nodes connected by lines) at the bottom right.
**Spatial Grounding:**
* The `PRODUCT DESC` inputs are stacked vertically on the far left.
* The `INITIAL ONTOLOGY` is positioned to the right of the first `PRODUCT DESC` and `LLM (CONSTRUCT)`.
* The versioned ontologies (`v1`, `v2`, `v3`) are arranged in a descending diagonal cascade towards the center.
* The refinement loop is in the upper right quadrant, with the `LLM (REFINE)` at the top.
* The final `ONTOLOGY` and the `LLM` that processes `PRODUCT DATA` are on the right side, leading to the network graph output in the bottom-right corner.
### Detailed Analysis
The process flow is as follows:
1. **Initial Construction:** A `PRODUCT DESC` is fed into an `LLM` with the action `CONSTRUCT`. The output of this step is an `INITIAL ONTOLOGY`.
2. **Iterative Expansion:** The `INITIAL ONTOLOGY` is then combined with additional `PRODUCT DESC` inputs. Each combination is processed by an `LLM` with the action `EXPAND`, resulting in a versioned ontology (`ONTOLOGY v1`, `v2`, `v3`). This suggests an incremental building process where new product information expands the existing knowledge structure.
3. **Refinement Loop:** The versioned ontology (implied to be the latest, e.g., `v3`) enters a refinement cycle. An `LLM` at the top performs a `REFINE` action. This action involves a stack of documents (likely representing source material or validation data) and feeds back into an `ONTOLOGY` node. This indicates a quality improvement or validation step.
4. **Application & Output:** The refined `ONTOLOGY` is then used in conjunction with `PRODUCT DATA`. Both are processed by a final `LLM`. The output of this LLM is a network graph, visualized as interconnected nodes. This represents the application of the structured ontology to real-world data to generate insights, relationships, or a knowledge graph.
### Key Observations
* **LLM-Centric Process:** Every transformative step (`CONSTRUCT`, `EXPAND`, `REFINE`, final processing) is explicitly mediated by an `LLM`, highlighting the central role of language models in this pipeline.
* **Iterative and Versioned:** The ontology is not built in one step. It starts as an "initial" version and is explicitly versioned (`v1`, `v2`, `v3`) as it expands, indicating a controlled, iterative development lifecycle.
* **Two-Phase Architecture:** The diagram clearly separates the *creation and expansion* of the ontology (left) from its *refinement and application* (right).
* **Input Types:** The system takes two distinct types of input: unstructured `PRODUCT DESC` (text descriptions) for building the ontology, and structured `PRODUCT DATA` for applying it.
* **Final Output:** The end product is not just a static ontology file, but a dynamic network graph, suggesting the system's purpose is to generate actionable relational data.
### Interpretation
This diagram outlines a sophisticated, AI-driven methodology for knowledge engineering. It demonstrates how LLMs can be leveraged to automate the traditionally manual and expert-intensive task of ontology development.
* **What it suggests:** The process is designed to be scalable and adaptive. Starting from a seed description, it can grow a comprehensive ontology by ingesting more product information. The refinement loop implies a mechanism for ensuring accuracy and consistency, possibly using the LLM to cross-check the ontology against source documents.
* **How elements relate:** The left side is the "learning" or "building" phase, where the system's knowledge base is constructed. The right side is the "operational" or "inference" phase, where that knowledge base is polished and put to work on concrete data to produce a useful output (the graph). The `PRODUCT DATA` likely contains instances or attributes that the ontology helps to structure and relate.
* **Notable implications:** This pipeline could significantly accelerate the creation of domain-specific knowledge graphs for applications like product recommendation, semantic search, or competitive analysis. The versioning suggests it's built for maintenance and evolution, allowing the ontology to keep pace with changing product lines. The final network graph output is the key deliverable, transforming raw data into an interconnected map of knowledge.