## Line Chart: BLEU Score vs. Sentence Length for Different RNN Models
### Overview
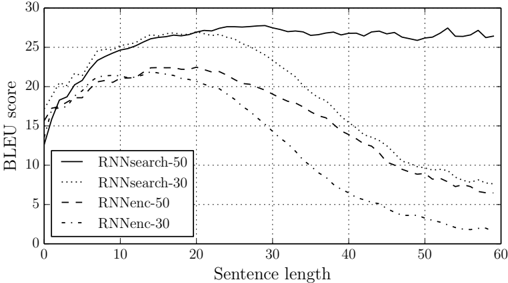
The image is a line chart comparing the BLEU (Bilingual Evaluation Understudy) scores of different Recurrent Neural Network (RNN) models as a function of sentence length. The chart displays four data series, each representing a different RNN model configuration. The x-axis represents sentence length, and the y-axis represents the BLEU score.
### Components/Axes
* **Title:** There is no explicit title on the chart.
* **X-axis:**
* Label: "Sentence length"
* Scale: 0 to 60, with tick marks at intervals of 10.
* **Y-axis:**
* Label: "BLEU score"
* Scale: 0 to 30, with tick marks at intervals of 5.
* **Legend:** Located in the bottom-left corner of the chart.
* RNNsearch-50 (solid line)
* RNNsearch-30 (dotted line)
* RNNenc-50 (dashed line)
* RNNenc-30 (dash-dotted line)
### Detailed Analysis
* **RNNsearch-50 (solid line):**
* Trend: Initially increases rapidly, plateaus around a sentence length of 20, and remains relatively constant thereafter.
* Data Points: Starts at approximately 16 BLEU score, rises to approximately 27 around sentence length 20, and fluctuates between 26 and 28 for sentence lengths between 20 and 60.
* **RNNsearch-30 (dotted line):**
* Trend: Increases rapidly, reaches a peak around a sentence length of 20, and then decreases gradually.
* Data Points: Starts at approximately 16 BLEU score, peaks at approximately 27 around sentence length 20, and decreases to approximately 7 around sentence length 60.
* **RNNenc-50 (dashed line):**
* Trend: Increases initially, reaches a peak around a sentence length of 20, and then decreases gradually.
* Data Points: Starts at approximately 14 BLEU score, peaks at approximately 22 around sentence length 20, and decreases to approximately 8 around sentence length 60.
* **RNNenc-30 (dash-dotted line):**
* Trend: Increases initially, reaches a peak around a sentence length of 10, and then decreases gradually.
* Data Points: Starts at approximately 12 BLEU score, peaks at approximately 21 around sentence length 10, and decreases to approximately 4 around sentence length 60.
### Key Observations
* RNNsearch-50 consistently outperforms the other models for longer sentences.
* All models except RNNsearch-50 show a decline in BLEU score as sentence length increases beyond a certain point.
* The "RNNsearch" models generally perform better than the "RNNenc" models.
* The "-50" variants of each model tend to perform better than the "-30" variants.
### Interpretation
The chart illustrates the performance of different RNN models in machine translation, as measured by the BLEU score. The BLEU score is a metric for evaluating the quality of machine-translated text by comparing it to human-produced reference translations.
The data suggests that the RNNsearch-50 model is more robust to increasing sentence length compared to the other models. The decline in BLEU score for the other models as sentence length increases indicates that they may struggle with longer sentences, possibly due to the vanishing gradient problem or limitations in their ability to capture long-range dependencies.
The better performance of the "RNNsearch" models compared to the "RNNenc" models suggests that the attention mechanism used in RNNsearch is beneficial for translation quality. The higher scores for the "-50" variants likely indicate that a larger hidden state size (50 units vs. 30 units) improves the model's capacity to learn and represent the complexities of the language.
The chart highlights the importance of model architecture and hyperparameter tuning in achieving good performance in machine translation tasks, particularly when dealing with longer sentences.