## Scatter Plots: Music Genre Distribution Across Valid and Test Sets
### Overview
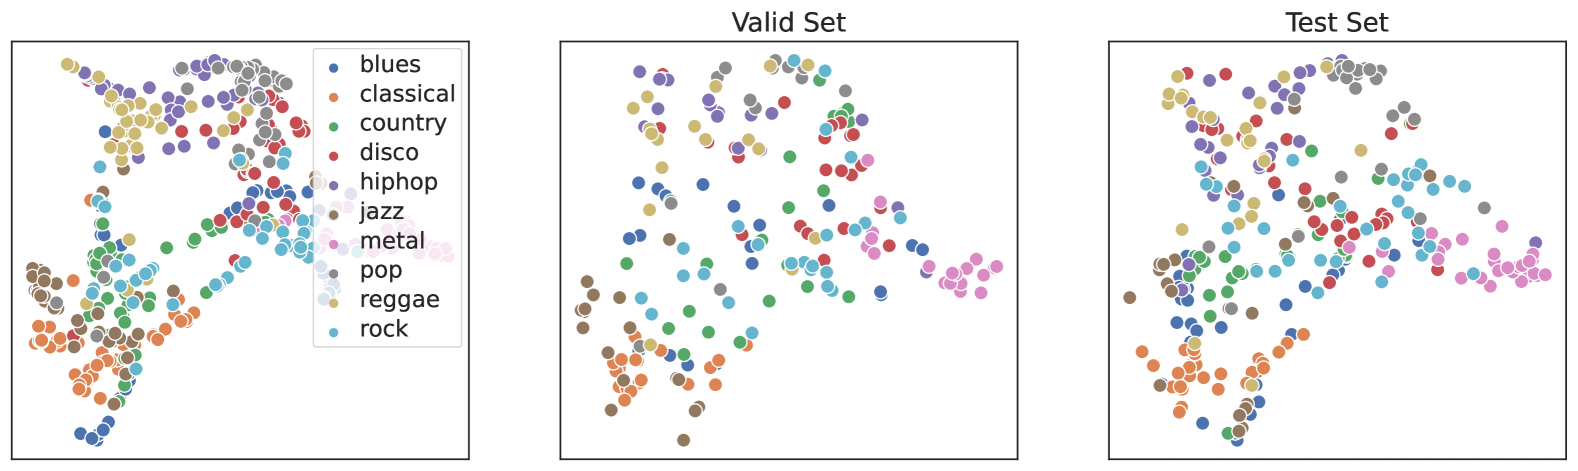
The image displays three scatter plots representing music genre distributions. The first plot is unlabeled, while the second and third are labeled "Valid Set" and "Test Set," respectively. Each plot uses colored dots to represent 10 music genres (blues, classical, country, disco, hip-hop, jazz, metal, pop, reggae, rock), with a legend on the left mapping colors to genres. The plots show clusters of dots, with varying degrees of overlap between genres.
### Components/Axes
- **Legend**: Located on the left side of the image, listing 10 genres with corresponding colors:
- Blues (blue)
- Classical (orange)
- Country (green)
- Disco (red)
- Hip-hop (purple)
- Jazz (gray)
- Metal (brown)
- Pop (pink)
- Reggae (yellow)
- Rock (cyan)
- **Plots**:
- **First Plot (Unlabeled)**: Contains clusters of dots with no explicit title.
- **Second Plot (Valid Set)**: Labeled "Valid Set," positioned to the right of the first plot.
- **Third Plot (Test Set)**: Labeled "Test Set," positioned to the right of the second plot.
- **Axes**: No explicit axis titles or scales are visible in the image.
### Detailed Analysis
- **Genre Distribution**:
- **Blues (blue)**: Concentrated in the lower-left region of all plots, with moderate spread.
- **Classical (orange)**: Dominates the lower-left quadrant in the first and second plots, with reduced density in the third.
- **Country (green)**: Spread across the middle-left region, with tighter clustering in the Valid Set.
- **Disco (red)**: Scattered throughout, with higher density in the Test Set.
- **Hip-hop (purple)**: Clustered in the upper-middle region, with slight overlap with jazz (gray) in all plots.
- **Jazz (gray)**: Overlaps with hip-hop (purple) and metal (brown), particularly in the Valid Set.
- **Metal (brown)**: Concentrated in the lower-middle region, with minimal overlap in the Test Set.
- **Pop (pink)**: Spread across the upper-right region, with tighter clustering in the Valid Set.
- **Reggae (yellow)**: Located in the upper-left quadrant, with moderate spread.
- **Rock (cyan)**: Dominates the upper-right quadrant, with high density in the Test Set.
- **Overlap and Clustering**:
- **Valid Set**: Shows tighter clustering for genres like classical (orange) and pop (pink), with moderate overlap between jazz (gray) and hip-hop (purple).
- **Test Set**: Exhibits broader dispersion for genres like disco (red) and rock (cyan), with increased overlap between blues (blue) and metal (brown).
- **Unlabeled Plot**: Resembles the Valid Set in clustering patterns but lacks explicit labeling.
### Key Observations
1. **Genre Separation**: Some genres (e.g., classical, pop) show distinct clustering, while others (e.g., jazz, hip-hop) exhibit significant overlap.
2. **Test Set Variability**: The Test Set displays more dispersed distributions for genres like disco and rock, suggesting potential challenges in generalization.
3. **Unlabeled Plot**: Its structure mirrors the Valid Set, implying it may represent training data or a baseline distribution.
### Interpretation
The scatter plots likely visualize the performance or distribution of a machine learning model across different music genres. The Valid Set and Test Set plots highlight how well the model generalizes to unseen data, with tighter clustering in the Valid Set indicating better in-distribution performance. Overlaps between genres (e.g., jazz and hip-hop) suggest potential misclassification risks, while the Test Set’s broader dispersion may reflect real-world variability. The unlabeled plot’s similarity to the Valid Set implies it could serve as a training or reference dataset.
**Note**: No numerical values or axis labels are provided in the image, so trends are described qualitatively based on visual patterns.