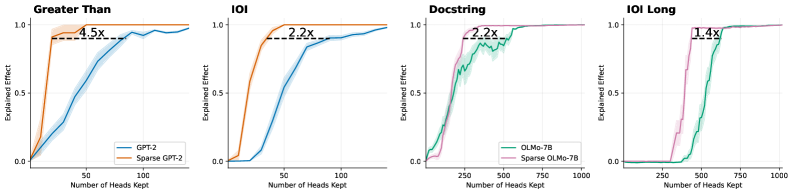
## Chart: Explained Effect vs. Number of Heads Kept for Different Models and Tasks
### Overview
The image presents four line charts comparing the "Explained Effect" against the "Number of Heads Kept" for different models (GPT-2 and OLMo-7B) and tasks (Greater Than, IOI, Docstring, and IOI Long). Each chart compares the performance of a standard model against a sparse version of the same model. The charts show how the explained effect changes as more heads are kept in the model.
### Components/Axes
* **X-axis (Horizontal):** "Number of Heads Kept". The scale varies across the charts.
* Greater Than and IOI: 0 to 100
* Docstring and IOI Long: 0 to 1000
* **Y-axis (Vertical):** "Explained Effect". The scale is consistent across all charts, ranging from 0.0 to 1.0.
* **Legends:**
* **Greater Than and IOI:**
* Blue line: "GPT-2"
* Tan line: "Sparse GPT-2"
* **Docstring and IOI Long:**
* Green line: "OLMo-7B"
* Pink line: "Sparse OLMo-7B"
* **Titles:**
* Top-left: "Greater Than"
* Top-middle-left: "IOI"
* Top-middle-right: "Docstring"
* Top-right: "IOI Long"
* **Annotations:** Each chart has a dashed horizontal line indicating the explained effect of the sparse model, along with a label indicating the multiplicative factor by which the standard model exceeds the sparse model's performance at that point.
### Detailed Analysis
**1. Greater Than**
* **GPT-2 (Blue):** The explained effect increases rapidly from 0 to approximately 0.9 between 0 and 50 heads kept, then plateaus around 0.95 as the number of heads kept increases to 100.
* **Sparse GPT-2 (Tan):** The explained effect increases rapidly from 0 to approximately 0.95 between 0 and 20 heads kept, then plateaus around 0.95 as the number of heads kept increases to 100.
* **Annotation:** "4.5x" is shown above a dashed line at approximately y=0.9, indicating that the GPT-2 model's explained effect is 4.5 times greater than the Sparse GPT-2 model's effect at the point where the Sparse GPT-2 model plateaus.
**2. IOI**
* **GPT-2 (Blue):** The explained effect increases from 0 to approximately 0.9 between 0 and 75 heads kept, then plateaus around 0.9 as the number of heads kept increases to 100.
* **Sparse GPT-2 (Tan):** The explained effect increases rapidly from 0 to approximately 0.9 between 0 and 25 heads kept, then plateaus around 0.95 as the number of heads kept increases to 100.
* **Annotation:** "2.2x" is shown above a dashed line at approximately y=0.9, indicating that the GPT-2 model's explained effect is 2.2 times greater than the Sparse GPT-2 model's effect at the point where the Sparse GPT-2 model plateaus.
**3. Docstring**
* **OLMo-7B (Green):** The explained effect increases from 0 to approximately 0.9 between 0 and 250 heads kept, then fluctuates between 0.8 and 1.0 as the number of heads kept increases to 1000.
* **Sparse OLMo-7B (Pink):** The explained effect increases from 0 to approximately 0.9 between 0 and 250 heads kept, then plateaus around 0.95 as the number of heads kept increases to 1000.
* **Annotation:** "2.2x" is shown above a dashed line at approximately y=0.9, indicating that the OLMo-7B model's explained effect is 2.2 times greater than the Sparse OLMo-7B model's effect at the point where the Sparse OLMo-7B model plateaus.
**4. IOI Long**
* **OLMo-7B (Green):** The explained effect remains near 0 until approximately 400 heads are kept, then increases rapidly to approximately 0.95 between 400 and 600 heads kept, then plateaus around 1.0 as the number of heads kept increases to 1000.
* **Sparse OLMo-7B (Pink):** The explained effect remains near 0 until approximately 250 heads are kept, then increases rapidly to approximately 0.95 between 250 and 500 heads kept, then plateaus around 1.0 as the number of heads kept increases to 1000.
* **Annotation:** "1.4x" is shown above a dashed line at approximately y=0.9, indicating that the OLMo-7B model's explained effect is 1.4 times greater than the Sparse OLMo-7B model's effect at the point where the Sparse OLMo-7B model plateaus.
### Key Observations
* In all four tasks, the sparse models reach a similar or slightly higher plateau in "Explained Effect" compared to their non-sparse counterparts.
* The "Greater Than" and "IOI" tasks show a more pronounced difference in the number of heads required to reach the plateau between the standard and sparse GPT-2 models.
* The "IOI Long" task shows a significant shift in the number of heads required for the OLMo-7B model to achieve a substantial explained effect compared to its sparse version.
* The annotations highlight the multiplicative factor by which the standard model's explained effect exceeds that of the sparse model at the point where the sparse model plateaus.
### Interpretation
The charts suggest that sparse models can achieve comparable or even slightly better performance (in terms of "Explained Effect") compared to their non-sparse counterparts, but often require fewer heads to reach a similar level of performance. This implies that sparsity can lead to more efficient models, potentially reducing computational costs without sacrificing performance. The multiplicative factors indicated by the annotations quantify the performance gap between the standard and sparse models at a specific point, providing a measure of the benefit gained by using the standard model. The differences in the number of heads required to reach the plateau between standard and sparse models may indicate that sparsity is more effective for certain tasks or model architectures. The "IOI Long" task, in particular, highlights the potential for sparsity to significantly shift the point at which the model begins to exhibit a substantial explained effect.