TECHNICAL ASSET FINGERPRINT
51102b68e2751989b4e96099
Click to view fullscreen
Press ESC or click to close
FOUND IN PAPERS
EXPERT: gemini-3.1-pro-preview VERSION 1
RUNTIME: gemini/gemini-3.1-pro-preview
INTEL_VERIFIED
## Line Charts: Efficiency Comparison of Standard vs. Sparse Language Models
### Overview
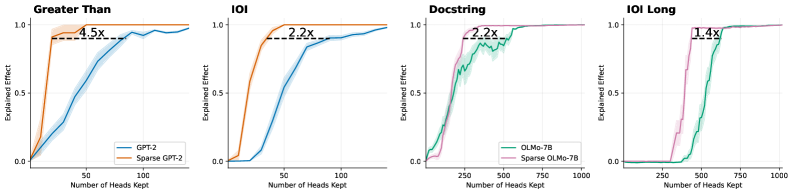
The image consists of a horizontal array of four line charts. Each chart compares the performance of a standard large language model against a "sparse" version of that same model across four different tasks. The charts demonstrate how many attention heads are required to achieve a certain level of "Explained Effect." The language present in the image is entirely English.
### Components/Axes
The image is divided into four distinct panels (sub-charts) arranged from left to right.
**Common Axes across all panels:**
* **Y-axis:** Labeled "Explained Effect". The scale runs from 0.0 at the bottom to 1.0 at the top, with tick marks at 0.0, 0.5, and 1.0.
* **X-axis:** Labeled "Number of Heads Kept". The scale varies depending on the model being evaluated.
* Panels 1 & 2 (GPT-2): Tick marks at 50 and 100. The axis appears to range from 0 to approximately 140.
* Panels 3 & 4 (OLMo-7B): Tick marks at 250, 500, 750, and 1000. The axis ranges from 0 to slightly over 1000.
**Legends:**
* **Panel 1 (Bottom Right):**
* Blue line = `GPT-2`
* Orange line = `Sparse GPT-2`
* **Panel 3 (Bottom Right):**
* Green line = `OLMo-7B`
* Pink/Purple line = `Sparse OLMo-7B`
*(Note: Panels 2 and 4 do not have explicit legends but visually inherit the color coding from Panels 1 and 3, respectively).*
**Annotations:**
Every panel features a horizontal dashed black line connecting the two curves at a high Y-value (approximately 0.9). Above this dashed line is a text label indicating a multiplier (e.g., "4.5x"). Shaded regions surrounding the solid lines indicate variance or confidence intervals.
---
### Detailed Analysis
#### Panel 1: Greater Than (Far Left)
* **Header/Title:** "Greater Than" (Top left of the panel).
* **Trend Verification:** The orange line (Sparse GPT-2) slopes upward extremely rapidly, reaching near-maximum effect with very few heads. The blue line (GPT-2) slopes upward much more gradually, requiring significantly more heads to reach the same level.
* **Data Points (Approximate):**
* **Sparse GPT-2 (Orange):** Starts at (0, 0). Rises sharply to ~0.9 at ~20 heads. Plateaus at 1.0 by ~40 heads.
* **GPT-2 (Blue):** Starts at (0, 0). Reaches 0.5 at ~50 heads. Reaches ~0.9 at ~90 heads. Approaches 1.0 at ~140 heads.
* **Annotation:** A dashed line connects the orange curve at X≈20 to the blue curve at X≈90, at Y≈0.9. The text reads **"4.5x"**.
#### Panel 2: IOI (Center Left)
* **Header/Title:** "IOI" (Top left of the panel).
* **Trend Verification:** The orange line (Sparse GPT-2) remains flat briefly, then slopes upward sharply. The blue line (GPT-2) remains flat for longer, then slopes upward at a moderate pace.
* **Data Points (Approximate):**
* **Sparse GPT-2 (Orange):** Starts at (0, 0). Rises to ~0.9 at ~40 heads. Plateaus at 1.0 by ~50 heads.
* **GPT-2 (Blue):** Flat at 0 until ~25 heads. Reaches 0.5 at ~50 heads. Reaches ~0.9 at ~90 heads.
* **Annotation:** A dashed line connects the orange curve at X≈40 to the blue curve at X≈90, at Y≈0.9. The text reads **"2.2x"**.
#### Panel 3: Docstring (Center Right)
* **Header/Title:** "Docstring" (Top left of the panel).
* **Trend Verification:** The pink line (Sparse OLMo-7B) slopes upward steeply starting around 100 heads. The green line (OLMo-7B) slopes upward more gradually and exhibits noticeable jaggedness and a wider shaded variance band compared to the other charts.
* **Data Points (Approximate):**
* **Sparse OLMo-7B (Pink):** Starts at (0, 0). Rises to ~0.9 at ~250 heads. Plateaus at 1.0 by ~300 heads.
* **OLMo-7B (Green):** Starts at (0, 0). Reaches 0.5 at ~200 heads. Reaches ~0.9 at ~550 heads. Plateaus at 1.0 by ~650 heads.
* **Annotation:** A dashed line connects the pink curve at X≈250 to the green curve at X≈550, at Y≈0.9. The text reads **"2.2x"**.
#### Panel 4: IOI Long (Far Right)
* **Header/Title:** "IOI Long" (Top left of the panel).
* **Trend Verification:** Both lines remain completely flat at 0 for a significant portion of the X-axis before shooting up almost vertically. The pink line (Sparse OLMo-7B) initiates its vertical climb much earlier than the green line (OLMo-7B).
* **Data Points (Approximate):**
* **Sparse OLMo-7B (Pink):** Flat at 0 until ~300 heads. Shoots vertically to ~0.9 at ~400 heads. Plateaus at 1.0 by ~450 heads.
* **OLMo-7B (Green):** Flat at 0 until ~450 heads. Shoots vertically to ~0.9 at ~550 heads. Plateaus at 1.0 by ~600 heads.
* **Annotation:** A dashed line connects the pink curve at X≈400 to the green curve at X≈550, at Y≈0.9. The text reads **"1.4x"**.
---
### Key Observations
1. **Consistent Superiority of Sparse Models:** In every single panel, the "Sparse" version of the model (Orange or Pink) is positioned to the left of the standard model (Blue or Green). This indicates that the sparse models achieve high "Explained Effect" using fewer "Heads Kept."
2. **The Multiplier Metric:** The dashed lines and text annotations (4.5x, 2.2x, 2.2x, 1.4x) represent a ratio of efficiency. It shows how many *more* heads the standard model needs to achieve roughly 90% (0.9) explained effect compared to the sparse model.
3. **Task Dependency:** The shape of the curves varies wildly by task. "Greater Than" and "Docstring" show gradual accumulation of effect. "IOI Long" shows a threshold effect, where the models explain nothing until a specific number of heads are kept, at which point they explain everything almost instantly.
4. **Model Scale Differences:** The GPT-2 charts (left half) operate on a scale of 0-140 heads. The OLMo-7B charts (right half) operate on a scale of 0-1000 heads, reflecting the vastly different architectural sizes of these two base models.
---
### Interpretation
This image serves as empirical evidence for the efficacy of a specific model sparsification technique (likely related to pruning attention heads in Transformer architectures).
**What the data means:**
The "Explained Effect" likely refers to how much of the model's performance on a specific task (like "Greater Than" logic, or "Docstring" generation) can be recovered or explained by a subset of its attention heads.
The data clearly demonstrates that standard models (GPT-2, OLMo-7B) have their task-specific knowledge distributed across a wide array of heads. To get 90% performance, you have to keep a large number of them.
Conversely, the "Sparse" models have been optimized so that task-critical information is concentrated into a much smaller number of heads.
**Reading between the lines (Peircean investigative):**
* **Efficiency Gains:** The annotations (e.g., "4.5x") are the core marketing/scientific claim of the chart. If Sparse GPT-2 can do the same job as GPT-2 using 4.5 times fewer heads, it implies massive potential savings in computational cost, memory footprint, and inference speed without sacrificing task performance.
* **The "IOI Long" Anomaly:** The step-function nature of the "IOI Long" chart suggests that this specific task requires a complex circuit of attention heads to function at all. If you don't have the complete circuit (e.g., fewer than 450 heads for standard OLMo-7B), performance is zero. The sparsification technique successfully compressed this necessary circuit from ~550 heads down to ~400 heads (a 1.4x improvement).
* **Variance:** The wider shaded bands on the standard models (especially visible in the "Docstring" panel) suggest that picking *which* heads to keep in a standard model yields highly variable results. The sparse models have much tighter confidence intervals, implying that the "important" heads are much more clearly defined and isolated.
DECODING INTELLIGENCE...