## Line Charts: Comparative Efficiency of Dense vs. Sparse Transformer Models
### Overview
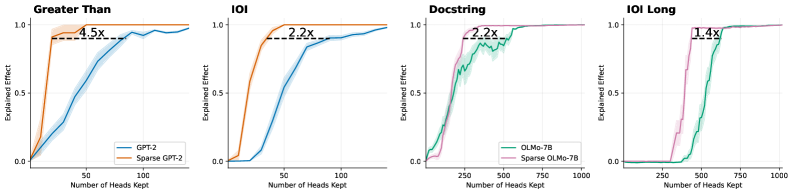
The image displays a set of four line charts arranged horizontally, comparing the performance of dense and sparse versions of two language models (GPT-2 and OLMo-7B) across four different evaluation tasks. The charts plot the "Explained Effect" (y-axis) against the "Number of Heads Kept" (x-axis), demonstrating how model performance scales with the number of attention heads retained after pruning. Each chart includes an annotation indicating a speedup factor.
### Components/Axes
* **Chart Titles (Top, Left to Right):** "Greater Than", "IOI", "Docstring", "IOI Long".
* **Y-Axis (All Charts):** Label: "Explained Effect". Scale: 0.0 to 1.0, with major ticks at 0.0, 0.5, and 1.0.
* **X-Axis (All Charts):** Label: "Number of Heads Kept".
* Charts 1 & 2 ("Greater Than", "IOI"): Scale 0 to 100, with major ticks at 0, 50, 100.
* Charts 3 & 4 ("Docstring", "IOI Long"): Scale 0 to 1000, with major ticks at 0, 250, 500, 750, 1000.
* **Legends (Bottom-Right of each chart):**
* Charts 1 & 2: Blue line = "GPT-2", Orange line = "Sparse GPT-2".
* Charts 3 & 4: Green line = "OLMo-7B", Pink line = "Sparse OLMo-7B".
* **Annotations (Within each chart):** A horizontal dashed black line connects a point on the sparse model's curve to a point on the dense model's curve at the same y-value (Explained Effect ≈ 0.95). A text label above this line indicates the speedup factor: "4.5x", "2.2x", "2.2x", and "1.4x" respectively.
### Detailed Analysis
**Chart 1: Greater Than**
* **Trend:** Both lines show a sigmoidal increase. The orange "Sparse GPT-2" line rises much more steeply from the origin than the blue "GPT-2" line.
* **Data Points (Approximate):** The Sparse GPT-2 curve reaches an Explained Effect of ~0.95 with approximately 22 heads kept. The standard GPT-2 curve reaches the same effect with approximately 100 heads kept.
* **Annotation:** The dashed line and label "4.5x" indicate that Sparse GPT-2 achieves the target performance with roughly 4.5 times fewer heads than standard GPT-2.
**Chart 2: IOI**
* **Trend:** Similar sigmoidal pattern. The orange "Sparse GPT-2" line again has a steeper initial ascent.
* **Data Points (Approximate):** Sparse GPT-2 reaches Explained Effect ~0.95 with ~45 heads. Standard GPT-2 reaches it with ~100 heads.
* **Annotation:** The "2.2x" label indicates a 2.2x efficiency gain for the sparse model on this task.
**Chart 3: Docstring**
* **Trend:** Both lines increase, but with more noise/fluctuation than the GPT-2 charts. The pink "Sparse OLMo-7B" line rises more sharply initially.
* **Data Points (Approximate):** Sparse OLMo-7B reaches Explained Effect ~0.95 with ~250 heads. Standard OLMo-7B reaches it with ~550 heads.
* **Annotation:** The "2.2x" label indicates a 2.2x efficiency gain.
**Chart 4: IOI Long**
* **Trend:** Both lines show a sharp, almost step-like increase. The pink "Sparse OLMo-7B" line's ascent is significantly earlier and steeper.
* **Data Points (Approximate):** Sparse OLMo-7B reaches Explained Effect ~0.95 with ~400 heads. Standard OLMo-7B reaches it with ~560 heads.
* **Annotation:** The "1.4x" label indicates a 1.4x efficiency gain, the smallest among the four tasks.
### Key Observations
1. **Consistent Superiority of Sparse Models:** In all four tasks, the sparse model variant (orange/pink) achieves a high "Explained Effect" with fewer attention heads than its dense counterpart (blue/green).
2. **Task-Dependent Speedup:** The efficiency gain (speedup factor) varies significantly by task, ranging from 1.4x to 4.5x. The "Greater Than" task shows the most dramatic benefit from sparsification.
3. **Performance Ceiling:** All models eventually approach an Explained Effect of 1.0, indicating that with enough heads, both dense and sparse models can fully explain the effect. The key difference is the *rate* of convergence.
4. **Model Architecture Difference:** The OLMo-7B charts (3 & 4) operate on a scale of hundreds of heads (x-axis up to 1000), while the GPT-2 charts (1 & 2) operate on a scale of tens of heads (x-axis up to 100), reflecting the different sizes/architectures of the base models.
### Interpretation
This set of charts provides strong empirical evidence for the **efficiency of sparse attention mechanisms** in transformer language models. The "Explained Effect" likely measures how well a subset of attention heads can replicate the full model's behavior on specific linguistic tasks (e.g., "Greater Than" for numerical comparison, "IOI" for indirect object identification).
The core finding is that **pruning (sparsifying) the model retains the most critical computational pathways**. The sparse models reach high performance with a fraction of the active parameters (heads), suggesting that dense models contain significant redundancy. The varying speedup factors (1.4x to 4.5x) imply that the "importance" or "dispersal" of critical information across heads is task-dependent. Some tasks ("Greater Than") may rely on a very small, core set of heads that are preserved in the sparse model, while others ("IOI Long") may have their critical functions more distributed, leading to a smaller efficiency gain upon pruning.
From a practical standpoint, this data supports the use of sparse models for **reducing computational cost and memory footprint** during inference without a proportional loss in performance on targeted tasks. The charts serve as a validation of the sparsification technique used, showing it successfully identifies and preserves the most salient model components.