## Line Graphs: Explained Effect vs. Number of Heads Kept
### Overview
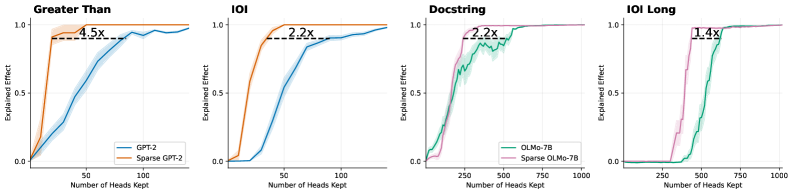
The image contains four line graphs comparing the performance of full models (GPT-2, OLMo-7B) and their sparse variants (Sparse GPT-2, Sparse OLMo-7B) across different natural language processing tasks. Each graph plots the "Explained Effect" (y-axis) against the "Number of Heads Kept" (x-axis), with annotations highlighting performance multipliers for sparse models.
### Components/Axes
1. **Graph Titles**:
- "Greater Than"
- "IOI"
- "Docstring"
- "IOI Long"
2. **Axes**:
- **X-axis**: "Number of Heads Kept" (ranges: 0–100 for first two graphs, 0–1000 for last two).
- **Y-axis**: "Explained Effect" (0.0 to 1.0, normalized).
3. **Legends**:
- **Top-left placement** in all graphs.
- **Colors**:
- Blue: Full models (GPT-2, OLMo-7B).
- Orange/Pink: Sparse models (Sparse GPT-2, Sparse OLMo-7B).
4. **Annotations**:
- Multiplier labels (e.g., "4.5x", "2.2x", "1.4x") near plateau points.
### Detailed Analysis
1. **Greater Than**:
- **Blue (GPT-2)**: Gradual increase, plateaus near 1.0 at ~50 heads.
- **Orange (Sparse GPT-2)**: Steeper rise, plateaus at ~1.0 with "4.5x" annotation.
2. **IOI**:
- **Blue (GPT-2)**: Slower ascent, plateaus near 1.0 at ~75 heads.
- **Orange (Sparse GPT-2)**: Faster rise, plateaus at ~1.0 with "2.2x" annotation.
3. **Docstring**:
- **Green (OLMo-7B)**: Steady climb, plateaus near 1.0 at ~750 heads.
- **Pink (Sparse OLMo-7B)**: Faster rise, plateaus at ~1.0 with "2.2x" annotation.
4. **IOI Long**:
- **Green (OLMo-7B)**: Gradual increase, plateaus near 1.0 at ~750 heads.
- **Pink (Sparse OLMo-7B)**: Steeper rise, plateaus at ~1.0 with "1.4x" annotation.
### Key Observations
1. **Sparse models consistently outperform full models** across tasks, achieving higher "Explained Effect" with fewer heads.
2. **Performance multipliers** (e.g., 4.5x, 2.2x) indicate sparse models require significantly fewer computational resources.
3. **Plateauing trends** suggest diminishing returns after a critical number of heads are retained.
4. **Task-specific efficiency**: Sparse GPT-2 shows the highest multiplier (4.5x), while Sparse OLMo-7B has the lowest (1.4x).
### Interpretation
The data demonstrates that sparse model architectures achieve comparable or superior performance to full models while using fewer computational resources. This efficiency is task-dependent:
- **Greater Than** and **IOI** tasks show the most significant gains (4.5x and 2.2x), suggesting these tasks rely heavily on attention mechanisms where sparsity is beneficial.
- **IOI Long**’s lower multiplier (1.4x) implies longer sequences may require more heads for optimal performance, even with sparsity.
- The consistent plateauing across graphs highlights a critical threshold for head retention, beyond which additional heads yield minimal gains.
This analysis underscores the potential of sparse models for optimizing NLP systems, balancing performance and resource efficiency.