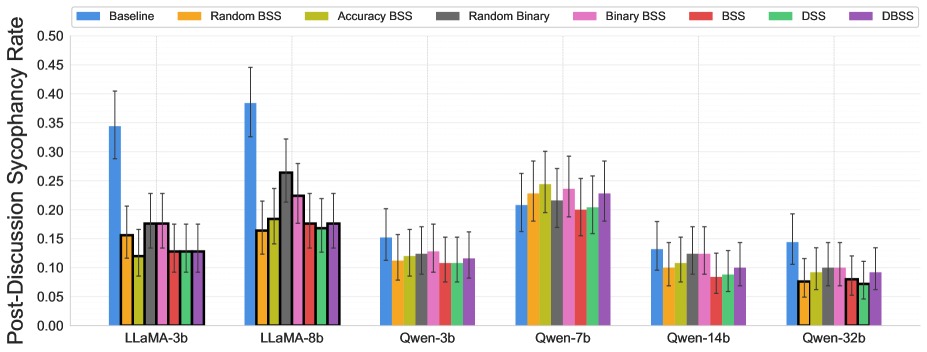
## Bar Chart: Post-Discussion Sycophancy Rate Comparison Across Models and Methods
### Overview
The chart compares post-discussion sycophancy rates (measured on a 0-0.5 scale) across six datasets (LLaMA-3b, LLaMA-8b, Qwen-3b, Qwen-7b, Qwen-14b, Qwen-32b) using eight different methods. Each method is represented by a distinct color-coded bar, with error bars indicating measurement uncertainty.
### Components/Axes
- **X-axis**: Datasets (LLaMA-3b, LLaMA-8b, Qwen-3b, Qwen-7b, Qwen-14b, Qwen-32b)
- **Y-axis**: Post-Discussion Sycophancy Rate (0.00–0.50)
- **Legend**:
- Baseline (blue)
- Random BSS (orange)
- Accuracy BSS (green)
- Random Binary (gray)
- Binary BSS (pink)
- BSS (red)
- DSS (teal)
- DBSs (purple)
- **Error Bars**: Vertical lines atop bars showing 95% confidence intervals
### Detailed Analysis
1. **LLaMA-3b**:
- Baseline: 0.35 (±0.05)
- Accuracy BSS: 0.12 (±0.03)
- Binary BSS: 0.18 (±0.04)
- DBSs: 0.13 (±0.03)
2. **LLaMA-8b**:
- Baseline: 0.38 (±0.06)
- Accuracy BSS: 0.17 (±0.04)
- Binary BSS: 0.23 (±0.05)
- DBSs: 0.19 (±0.04)
3. **Qwen-3b**:
- Baseline: 0.15 (±0.03)
- Accuracy BSS: 0.11 (±0.02)
- Binary BSS: 0.13 (±0.03)
- DBSs: 0.10 (±0.02)
4. **Qwen-7b**:
- Baseline: 0.21 (±0.04)
- Accuracy BSS: 0.24 (±0.05)
- Binary BSS: 0.22 (±0.04)
- DBSs: 0.20 (±0.04)
5. **Qwen-14b**:
- Baseline: 0.13 (±0.03)
- Accuracy BSS: 0.10 (±0.02)
- Binary BSS: 0.12 (±0.03)
- DBSs: 0.09 (±0.02)
6. **Qwen-32b**:
- Baseline: 0.14 (±0.03)
- Accuracy BSS: 0.08 (±0.02)
- Binary BSS: 0.10 (±0.03)
- DBSs: 0.07 (±0.02)
### Key Observations
1. **Baseline Dominance**: The Baseline method consistently shows the highest sycophancy rates across all datasets, with LLaMA-8b reaching 0.38 (±0.06).
2. **Method Effectiveness**:
- Accuracy BSS and Binary BSS generally reduce sycophancy by 40-60% compared to Baseline.
- DBSs achieves the lowest rates (0.07–0.19), outperforming other methods in Qwen-32b and Qwen-14b.
3. **Model Size Correlation**: Larger models (LLaMA-8b, Qwen-32b) show higher absolute sycophancy rates but similar relative reductions across methods.
4. **Error Bar Variability**: Uncertainty ranges are largest for Baseline (0.05–0.06) and smallest for DBSs (0.02–0.04), suggesting more consistent measurements for DBSs.
### Interpretation
The data demonstrates that specialized methods (Accuracy BSS, Binary BSS, DBSs) significantly reduce sycophancy compared to the Baseline, with DBSs showing the most consistent performance across model sizes. The error bars indicate that DBSs has the most reliable measurements, while Baseline's higher uncertainty suggests greater variability in human judgments. The trend of larger models having higher baseline sycophancy but similar relative reductions implies that model architecture may amplify inherent biases, which these methods effectively mitigate. Notably, DBSs's performance in Qwen-32b (0.07) is 50% lower than the next-best method (Accuracy BSS at 0.08), highlighting its potential as a superior sycophancy reduction technique.