## Chart: Normalization Angle Circular Distributions across Time-steps
### Overview
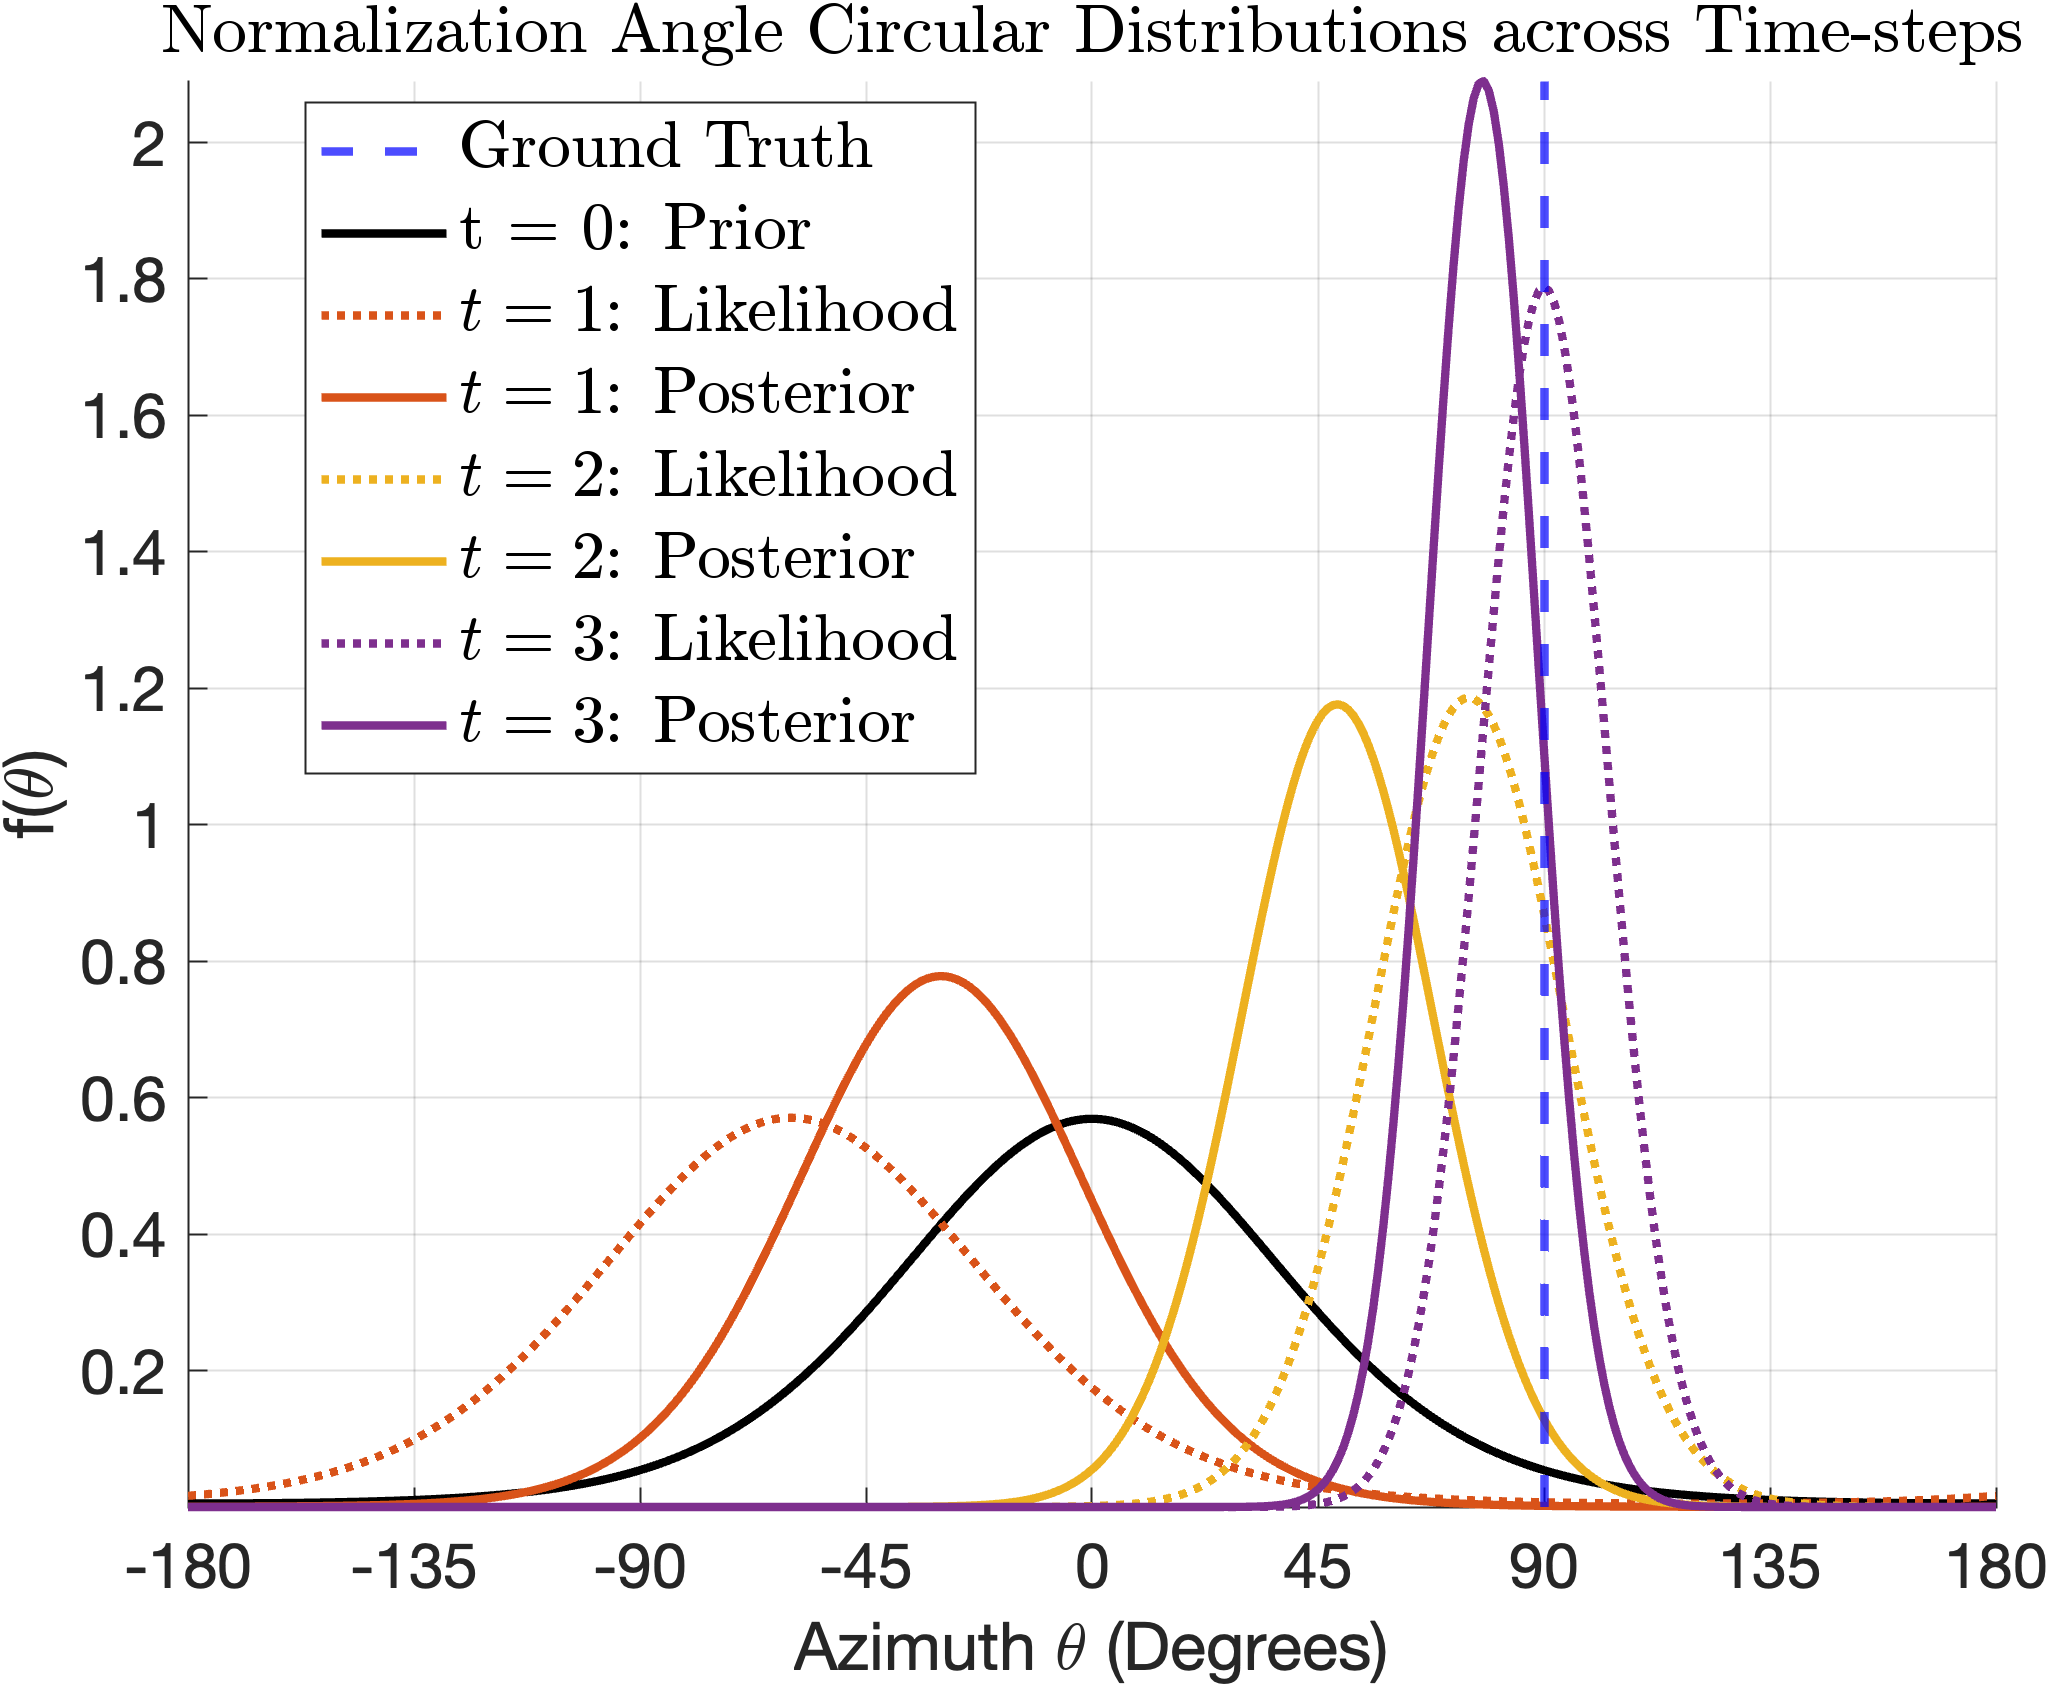
The image is a line chart displaying the probability density functions of normalization angles across different time steps. It compares the "Ground Truth" with "Prior" distributions at time t=0, and "Likelihood" and "Posterior" distributions at times t=1, t=2, and t=3. The x-axis represents the azimuth angle in degrees, and the y-axis represents the probability density f(θ).
### Components/Axes
* **Title:** Normalization Angle Circular Distributions across Time-steps
* **X-axis:**
* Label: Azimuth θ (Degrees)
* Scale: -180 to 180 degrees, with markers at -180, -135, -90, -45, 0, 45, 90, 135, and 180.
* **Y-axis:**
* Label: f(θ)
* Scale: 0 to 2, with markers at 0, 0.2, 0.4, 0.6, 0.8, 1, 1.2, 1.4, 1.6, 1.8, and 2.
* **Legend (Top-Left):**
* Blue Dashed Line: Ground Truth
* Black Solid Line: t = 0: Prior
* Brown Dotted Line: t = 1: Likelihood
* Orange Solid Line: t = 1: Posterior
* Yellow Dotted Line: t = 2: Likelihood
* Gold Solid Line: t = 2: Posterior
* Purple Dotted Line: t = 3: Likelihood
* Purple Solid Line: t = 3: Posterior
### Detailed Analysis
* **Ground Truth (Blue Dashed Line):** A vertical line at approximately 90 degrees, indicating a fixed true angle.
* **t = 0: Prior (Black Solid Line):** A bell-shaped curve centered around 0 degrees, with a peak probability density of approximately 0.57.
* **t = 1: Likelihood (Brown Dotted Line):** A bell-shaped curve centered around -45 degrees, with a peak probability density of approximately 0.78.
* **t = 1: Posterior (Orange Solid Line):** A bell-shaped curve centered around 0 degrees, with a peak probability density of approximately 1.1.
* **t = 2: Likelihood (Yellow Dotted Line):** A bell-shaped curve centered around 45 degrees, with a peak probability density of approximately 1.15.
* **t = 2: Posterior (Gold Solid Line):** A bell-shaped curve centered around 67 degrees, with a peak probability density of approximately 1.7.
* **t = 3: Likelihood (Purple Dotted Line):** A bell-shaped curve centered around 80 degrees, with a peak probability density of approximately 1.7.
* **t = 3: Posterior (Purple Solid Line):** A bell-shaped curve centered around 90 degrees, with a peak probability density of approximately 2.1.
**Trend Verification:**
* The "Prior" distribution is centered at 0 degrees.
* The "Likelihood" distributions shift from -45 degrees (t=1) to 45 degrees (t=2) to 80 degrees (t=3).
* The "Posterior" distributions shift from 0 degrees (t=1) to 67 degrees (t=2) to 90 degrees (t=3).
* The "Posterior" distributions become more concentrated around the "Ground Truth" as time progresses.
### Key Observations
* The "Prior" distribution represents the initial belief about the angle.
* The "Likelihood" distributions represent the information obtained from the data at each time step.
* The "Posterior" distributions represent the updated belief about the angle after incorporating the data.
* As time progresses, the "Posterior" distributions converge towards the "Ground Truth," indicating that the estimation of the angle improves with more data.
### Interpretation
The chart illustrates a Bayesian inference process where the initial "Prior" belief is updated with new "Likelihood" information at each time step to obtain a "Posterior" estimate. The convergence of the "Posterior" distributions towards the "Ground Truth" demonstrates the effectiveness of this process in refining the estimate of the normalization angle over time. The shift in the "Likelihood" distributions indicates that the data provides increasingly accurate information about the true angle as time progresses. The "Posterior" distributions become more peaked and centered around the "Ground Truth" as more data is incorporated, indicating a reduction in uncertainty and an improvement in the accuracy of the angle estimation.