## Stacked Bar Chart: Pythia 6.9B
### Overview
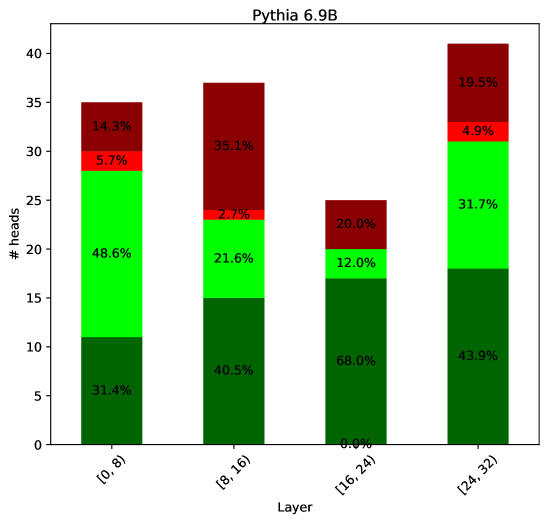
The image is a stacked bar chart titled "Pythia 6.9B". It displays the distribution of attention heads across different layers of the Pythia 6.9B model. The x-axis represents the layer, divided into four categories: "[0, 8)", "[8, 16)", "[16, 24)", and "[24, 32)". The y-axis represents the number of heads. Each bar is segmented into three colored sections (dark green, light green, red, and dark red), each representing a proportion of the total number of heads for that layer. The percentages for each segment are labeled on the chart.
### Components/Axes
* **Title:** Pythia 6.9B
* **X-axis:** Layer, with categories: \[0, 8), \[8, 16), \[16, 24), \[24, 32)
* **Y-axis:** # heads, ranging from 0 to 40.
* **Bar Colors (implied legend):**
* Dark Green: Represents the base layer.
* Light Green: Represents the second layer.
* Red: Represents the third layer.
* Dark Red: Represents the top layer.
### Detailed Analysis
* **Layer \[0, 8):**
* Dark Green: 31.4% (approximately 11 heads)
* Light Green: 48.6% (approximately 17 heads)
* Red: 5.7% (approximately 2 heads)
* Dark Red: 14.3% (approximately 5 heads)
* **Layer \[8, 16):**
* Dark Green: 40.5% (approximately 15 heads)
* Light Green: 21.6% (approximately 8 heads)
* Red: 2.7% (approximately 1 head)
* Dark Red: 35.1% (approximately 13 heads)
* **Layer \[16, 24):**
* Dark Green: 68.0% (approximately 17 heads)
* Light Green: 12.0% (approximately 3 heads)
* Red: 0.0% (approximately 0 heads)
* Dark Red: 20.0% (approximately 5 heads)
* **Layer \[24, 32):**
* Dark Green: 43.9% (approximately 17 heads)
* Light Green: 31.7% (approximately 12 heads)
* Red: 4.9% (approximately 2 heads)
* Dark Red: 19.5% (approximately 8 heads)
### Key Observations
* The dark green segment (base layer) is most prominent in the \[16, 24) layer.
* The dark red segment (top layer) is most prominent in the \[8, 16) layer.
* The red segment (third layer) is smallest in the \[8, 16) and \[16, 24) layers.
* The light green segment (second layer) is most prominent in the \[0, 8) layer.
### Interpretation
The stacked bar chart visualizes the distribution of attention heads across different layers of the Pythia 6.9B model. The data suggests that the importance or contribution of each layer varies depending on the overall layer depth. For example, the base layer (dark green) seems to be more dominant in the middle layers \[16, 24), while the top layer (dark red) is more prominent in the \[8, 16) layer. The red layer is consistently the smallest, suggesting it might play a less significant role in the model's overall attention mechanism. The distribution of attention heads across layers likely reflects the model's architecture and how it processes information at different stages.