## Stacked Bar Chart: Pythia 6.9B Layer Activation Distribution
### Overview
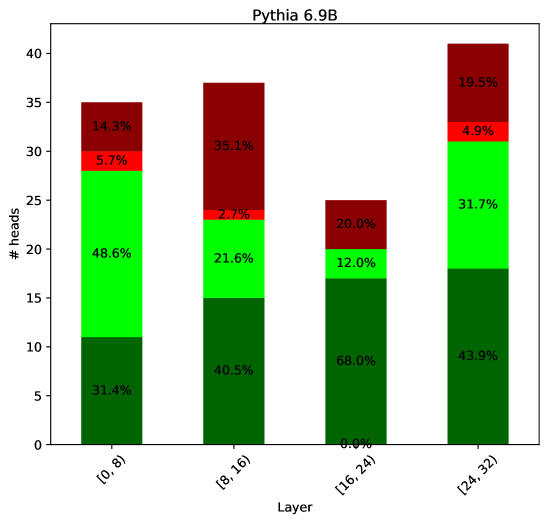
This image presents a stacked bar chart visualizing the distribution of activations (represented as "# heads") across different layers of the Pythia 6.9B model. The x-axis represents the layer, categorized into ranges: [0, 8], [8, 16], [16, 24], and [24, 32]. The y-axis represents the number of heads, ranging from 0 to 40. Each bar is segmented into colored sections, with each color representing a percentage of the total heads for that layer.
### Components/Axes
* **Title:** "Pythia 6.9B" (positioned at the top-center)
* **X-axis Label:** "Layer" (positioned at the bottom-center)
* **X-axis Markers:** [0, 8], [8, 16], [16, 24], [24, 32]
* **Y-axis Label:** "# heads" (positioned vertically on the left side)
* **Y-axis Scale:** 0 to 40, with increments of 5.
* **Color Legend (Implicit):**
* Dark Red: Represents a percentage of heads.
* Red: Represents a percentage of heads.
* Lime Green: Represents a percentage of heads.
* Dark Green: Represents a percentage of heads.
### Detailed Analysis
The chart consists of four stacked bars, one for each layer range. The percentages within each bar sum to 100%.
* **Layer [0, 8]:**
* Dark Green: 31.4%
* Lime Green: 48.6%
* Red: 5.7%
* Dark Red: 14.3%
* Total Heads: Approximately 28.
* **Layer [8, 16]:**
* Dark Green: 40.5%
* Lime Green: 21.6%
* Red: 2.7%
* Dark Red: 35.1%
* Total Heads: Approximately 38.
* **Layer [16, 24]:**
* Dark Green: 68.0%
* Lime Green: 12.0%
* Red: 20.0%
* Dark Red: 0.0%
* Total Heads: Approximately 25.
* **Layer [24, 32]:**
* Dark Green: 43.9%
* Lime Green: 31.7%
* Red: 4.9%
* Dark Red: 19.5%
* Total Heads: Approximately 40.
### Key Observations
* The distribution of activations varies significantly across layers.
* Layer [16, 24] has a dominant proportion of dark green activations (68.0%), while layer [0, 8] has a more balanced distribution.
* The dark red activation percentage is highest in layer [8, 16] (35.1%) and lowest in layer [16, 24] (0.0%).
* The lime green activation percentage is highest in layer [0, 8] (48.6%) and lowest in layer [24, 32] (31.7%).
### Interpretation
This chart likely represents the activation patterns of different attention heads within the Pythia 6.9B model across its layers. The stacked bars show how the "heads" (likely representing different attention mechanisms) are contributing to the overall output at each layer. The varying distributions suggest that different layers specialize in different types of processing.
The high dark green activation in layer [16, 24] could indicate that this layer is heavily involved in core feature extraction or a dominant processing pathway. The absence of dark red activation in the same layer is notable and might suggest a lack of specific attention focus in that layer.
The differences in activation distributions across layers could be indicative of the model's hierarchical structure, where lower layers focus on basic feature detection (more balanced distribution) and higher layers perform more complex reasoning (more specialized distributions). The percentages provide a quantitative measure of how much each type of activation contributes to the overall model behavior at each layer. The data suggests that the model's internal representation changes significantly as information flows through the layers.