## Bar Chart: Pythia 6.9B Layer Head Distribution
### Overview
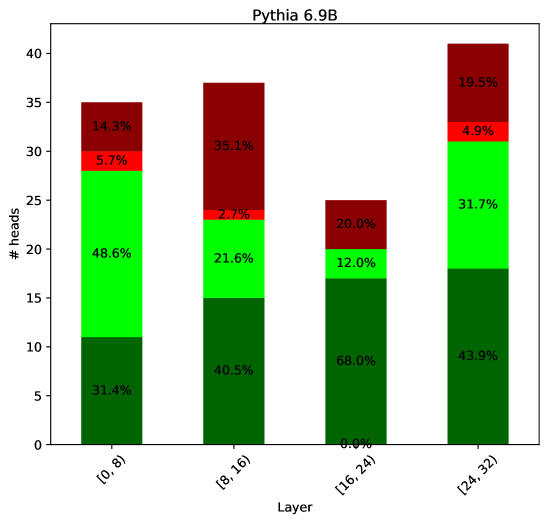
The chart visualizes the distribution of attention heads across four layer ranges in the Pythia 6.9B model. Each bar is segmented into three colors (green, dark green, red) representing different proportions of attention heads, with percentages labeled on each segment.
### Components/Axes
- **X-axis (Layer)**: Categorized into four ranges: [0, 8], [8, 16], [16, 24], [24, 32].
- **Y-axis (# heads)**: Scaled from 0 to 40, representing the number of attention heads.
- **Legend**: Located on the right, associating colors with percentages:
- Green: 31.4%
- Dark Green: 40.5%
- Red: 14.3%
### Detailed Analysis
1. **Layer [0, 8]**:
- Green (48.6%): Largest segment, occupying nearly half the bar.
- Dark Green (31.4%): Middle segment.
- Red (14.3%): Smallest segment at the top.
2. **Layer [8, 16]**:
- Green (21.6%): Smallest segment.
- Dark Green (40.5%): Middle segment.
- Red (35.1%): Largest segment, dominating the bar.
3. **Layer [16, 24]**:
- Green (12.0%): Smallest segment.
- Dark Green (68.0%): Largest segment, occupying over two-thirds of the bar.
- Red (20.0%): Middle segment.
4. **Layer [24, 32]**:
- Green (31.7%): Middle segment.
- Dark Green (43.9%): Largest segment.
- Red (19.5%): Smallest segment.
### Key Observations
- **Dominance of Dark Green**: The dark green segment (40.5% in legend) is consistently the largest in [8, 16] and [16, 24] layers, peaking at 68.0% in [16, 24].
- **Green Segment Decline**: The green segment (31.4% in legend) decreases sharply from 48.6% in [0, 8] to 12.0% in [16, 24], then rebounds to 31.7% in [24, 32].
- **Red Segment Peaks**: The red segment (14.3% in legend) is largest in [8, 16] (35.1%) but drops to 19.5% in [24, 32].
### Interpretation
The chart reveals a layered hierarchy in attention head distribution:
1. **Early Layers ([0, 8])**: Green segments dominate, suggesting simpler or foundational processing mechanisms.
2. **Middle Layers ([8, 16] and [16, 24])**: Dark green segments (likely representing core attention mechanisms) become dominant, with [16, 24] showing the highest concentration (68.0%). This may indicate increased complexity or specialization in these layers.
3. **Late Layers ([24, 32])**: A balance between dark green and green segments, with red segments shrinking, possibly reflecting refined or optimized processing.
**Notable Anomalies**:
- The legend's percentages (31.4%, 40.5%, 14.3%) do not align with the actual segment values in the bars. For example, the green segment in [0, 8] is 48.6%, far exceeding the legend's 31.4%. This discrepancy suggests the legend may represent average values across layers rather than per-layer distributions.
- The red segment's peak in [8, 16] (35.1%) contrasts with its decline in later layers, hinting at a shift in attention mechanisms as depth increases.
This distribution implies that Pythia 6.9B allocates attention heads differently across layers, with middle layers prioritizing complex interactions (dark green) and early/late layers balancing simpler and refined mechanisms.