## Line Graphs: Thinking Block Saliency Across Layers
### Overview
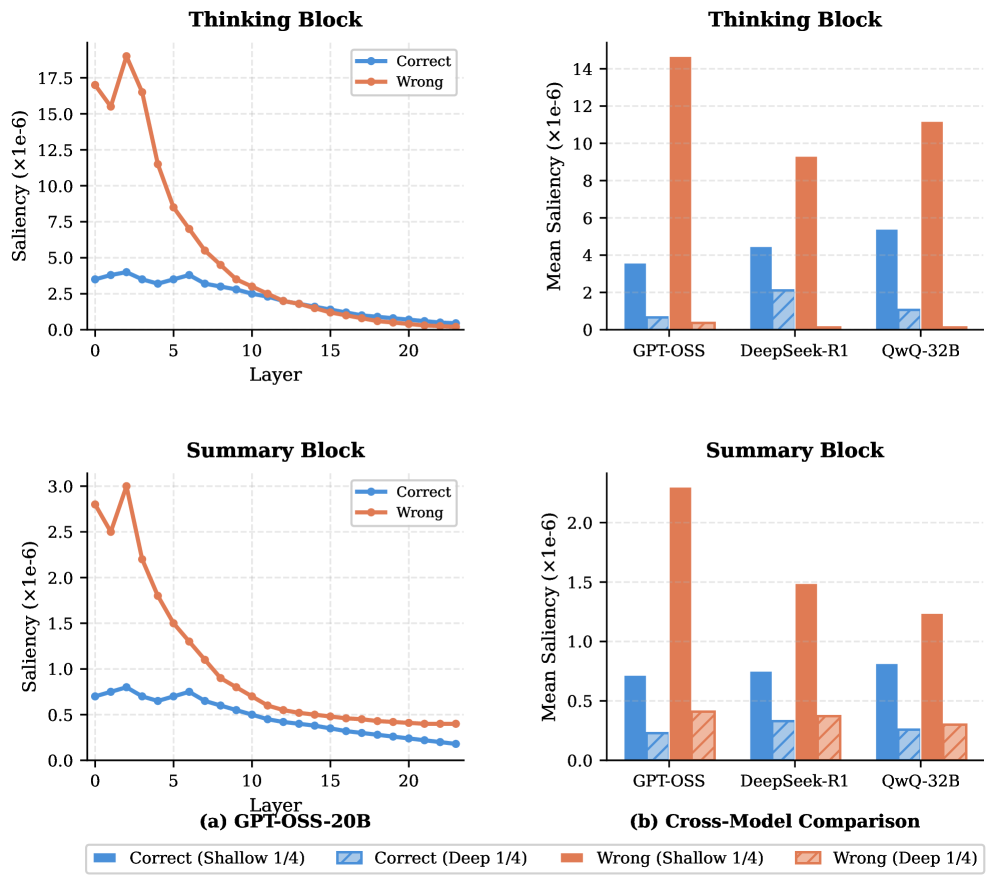
Two line graphs compare saliency values (x1e-6) across layers (0-20) for "Correct" and "Wrong" predictions in a "Thinking Block" architecture. The left graph shows data for GPT-OSS-20B, while the right graph compares cross-model performance (GPT-OSS, DeepSeek-R1, QwQ-32B).
### Components/Axes
- **X-axis**: Layer (0-20)
- **Y-axis**: Saliency (x1e-6)
- **Legends**:
- **Blue (solid)**: Correct predictions
- **Red (dashed)**: Wrong predictions
### Detailed Analysis
#### Left Graph (GPT-OSS-20B):
- **Correct (blue)**:
- Starts at ~3.5e-6 (layer 0), peaks at ~4.5e-6 (layer 2), then declines steadily to ~0.5e-6 (layer 20).
- Trend: Gradual decay after layer 2.
- **Wrong (red)**:
- Starts at ~16e-6 (layer 0), spikes to ~18e-6 (layer 2), then drops sharply to ~1e-6 (layer 20).
- Trend: Steep decline after layer 2.
#### Right Graph (Cross-Model Comparison):
- **Mean Saliency (x1e-6)**:
- **GPT-OSS**:
- Correct: ~3.5e-6
- Wrong: ~14e-6
- **DeepSeek-R1**:
- Correct: ~4.2e-6
- Wrong: ~9e-6
- **QwQ-32B**:
- Correct: ~5e-6
- Wrong: ~11e-6
### Key Observations
1. **Layer Dependency**: Saliency for both Correct and Wrong predictions decreases significantly with deeper layers in GPT-OSS-20B.
2. **Model Performance**:
- GPT-OSS has the highest Wrong saliency (14e-6) and lowest Correct saliency (3.5e-6).
- QwQ-32B shows the highest Correct saliency (5e-6) but still high Wrong saliency (11e-6).
3. **Anomaly**: The red (Wrong) line in GPT-OSS-20B spikes at layer 2 before declining, suggesting a transient error pattern.
### Interpretation
- **Thinking Block Dynamics**: The sharp decline in Wrong saliency after layer 2 in GPT-OSS-20B implies that deeper layers may suppress erroneous predictions, though Correct saliency remains low overall.
- **Model Comparison**: Cross-model data reveals a trade-off between Correct and Wrong saliency. QwQ-32B balances higher Correct saliency with moderate Wrong saliency, suggesting better error handling than GPT-OSS.
- **Practical Implication**: Models with higher Correct saliency (e.g., QwQ-32B) may prioritize relevant features, while lower Wrong saliency indicates reduced reliance on misleading patterns.
## Bar Charts: Summary Block Saliency
### Overview
Two bar charts compare mean saliency (x1e-6) for "Correct" and "Wrong" predictions in a "Summary Block" across three models: GPT-OSS, DeepSeek-R1, and QwQ-32B.
### Components/Axes
- **X-axis**: Models (GPT-OSS, DeepSeek-R1, QwQ-32B)
- **Y-axis**: Mean Saliency (x1e-6)
- **Legends**:
- **Blue (solid)**: Correct predictions
- **Red (striped)**: Wrong predictions
### Detailed Analysis
#### Left Chart (GPT-OSS-20B):
- **Correct (blue)**: ~0.7e-6
- **Wrong (red)**: ~0.4e-6
#### Right Chart (Cross-Model Comparison):
- **GPT-OSS**:
- Correct: ~0.7e-6
- Wrong: ~0.4e-6
- **DeepSeek-R1**:
- Correct: ~0.8e-6
- Wrong: ~0.3e-6
- **QwQ-32B**:
- Correct: ~0.9e-6
- Wrong: ~0.2e-6
### Key Observations
1. **Model Consistency**: All models show higher Correct saliency than Wrong saliency in the Summary Block.
2. **QwQ-32B Advantage**: Highest Correct saliency (0.9e-6) and lowest Wrong saliency (0.2e-6), indicating superior summarization accuracy.
3. **GPT-OSS Limitation**: Lowest Correct saliency (0.7e-6) and moderate Wrong saliency (0.4e-6), suggesting weaker summarization performance.
### Interpretation
- **Summary Block Efficiency**: The Summary Block amplifies Correct saliency while suppressing Wrong saliency compared to the Thinking Block.
- **Model Hierarchy**: QwQ-32B outperforms others in leveraging relevant features (high Correct) and ignoring irrelevant ones (low Wrong).
- **Cross-Block Comparison**: The Thinking Block’s higher saliency values (e.g., 14e-6 Wrong in GPT-OSS) suggest it is more sensitive to errors, while the Summary Block refines predictions.
## Final Synthesis
The data demonstrates that deeper layers in the Thinking Block reduce saliency for both Correct and Wrong predictions, with QwQ-32B showing the most balanced performance. The Summary Block further refines this by prioritizing Correct saliency, highlighting QwQ-32B’s superiority in handling summarization tasks. These trends underscore the importance of layer depth and model architecture in balancing accuracy and error mitigation.