## Heatmap: Dataset Correlation
### Overview
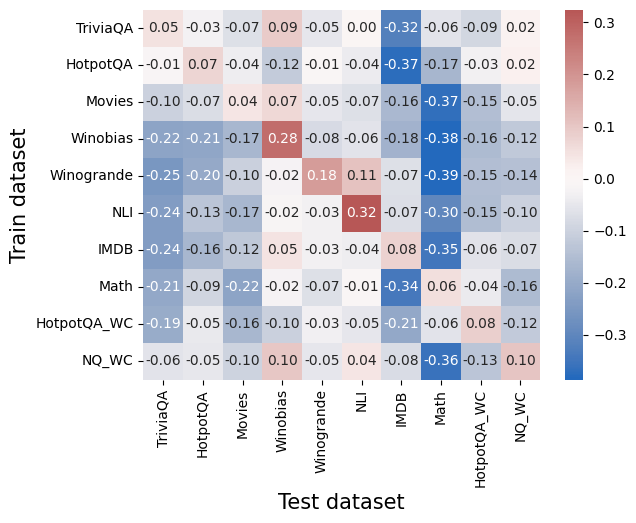
The image is a heatmap visualizing the correlation between different datasets when used for training and testing a model. The rows represent the training dataset, the columns represent the testing dataset, and the color of each cell indicates the correlation score, ranging from -0.3 (strong negative correlation, blue) to 0.3 (strong positive correlation, red).
### Components/Axes
* **Y-axis (Train dataset):**
* TriviaQA
* HotpotQA
* Movies
* Winobias
* Winogrande
* NLI
* IMDB
* Math
* HotpotQA\_WC
* NQ\_WC
* **X-axis (Test dataset):**
* TriviaQA
* HotpotQA
* Movies
* Winobias
* Winogrande
* NLI
* IMDB
* Math
* HotpotQA\_WC
* NQ\_WC
* **Color Legend (Right side):**
* Red: Positive correlation, ranging from 0 to 0.3
* White: Near zero correlation, around 0
* Blue: Negative correlation, ranging from -0.3 to 0
### Detailed Analysis or ### Content Details
Here's a breakdown of the correlation values for each combination of training and testing datasets:
| Train Dataset | TriviaQA | HotpotQA | Movies | Winobias | Winogrande | NLI | IMDB | Math | HotpotQA_WC | NQ_WC |
|---|---|---|---|---|---|---|---|---|---|---|
| TriviaQA | -0.05 | -0.03 | -0.07 | 0.09 | -0.05 | 0.00 | -0.32 | -0.06 | -0.09 | 0.02 |
| HotpotQA | -0.01 | 0.07 | -0.04 | -0.12 | -0.01 | -0.04 | -0.37 | -0.17 | -0.03 | 0.02 |
| Movies | -0.10 | -0.07 | 0.04 | 0.07 | -0.05 | -0.07 | -0.16 | -0.37 | -0.15 | -0.05 |
| Winobias | -0.22 | -0.21 | -0.17 | 0.28 | -0.08 | -0.06 | -0.18 | -0.38 | -0.16 | -0.12 |
| Winogrande | -0.25 | -0.20 | -0.10 | -0.02 | 0.18 | 0.11 | -0.07 | -0.39 | -0.15 | -0.14 |
| NLI | -0.24 | -0.13 | -0.17 | -0.02 | -0.03 | 0.32 | -0.07 | -0.30 | -0.15 | -0.10 |
| IMDB | -0.24 | -0.16 | -0.12 | 0.05 | -0.03 | -0.04 | 0.08 | -0.35 | -0.06 | -0.07 |
| Math | -0.21 | -0.09 | -0.22 | -0.02 | -0.07 | -0.01 | -0.34 | 0.06 | -0.04 | -0.16 |
| HotpotQA_WC | -0.19 | -0.05 | -0.16 | -0.10 | -0.03 | -0.05 | -0.21 | -0.06 | 0.08 | -0.12 |
| NQ_WC | -0.06 | -0.05 | -0.10 | 0.10 | -0.05 | 0.04 | -0.08 | -0.36 | -0.13 | 0.10 |
### Key Observations
* **Strong Negative Correlations:** Training on TriviaQA, HotpotQA, Movies, Math, HotpotQA_WC, or NQ_WC and testing on IMDB shows a strong negative correlation (values around -0.3 or lower).
* **Positive Correlations:** Training on Winobias and testing on Winobias shows a positive correlation (0.28). Training on NLI and testing on NLI also shows a positive correlation (0.32).
* **Near-Zero Correlations:** Many combinations show near-zero correlations, indicated by the light color.
### Interpretation
The heatmap reveals how well a model trained on one dataset generalizes to another. The strong negative correlations suggest that models trained on certain datasets (e.g., TriviaQA, HotpotQA) perform poorly when tested on IMDB. This could be due to differences in the nature of the questions, the style of the text, or the complexity of the tasks. The positive correlations indicate that models trained and tested on the same dataset perform well, as expected. The near-zero correlations suggest that there is little relationship between the datasets in terms of model performance. The negative correlations with IMDB are particularly notable and warrant further investigation.