TECHNICAL ASSET FINGERPRINT
5143b5e486b23fd731b04645
Click to view fullscreen
Press ESC or click to close
FOUND IN PAPERS
EXPERT: gemma-3-27b-it-free VERSION 1
RUNTIME: google-free/gemma-3-27b-it
INTEL_VERIFIED
\n
## Heatmap: Correlation Matrix of Dataset Performance
### Overview
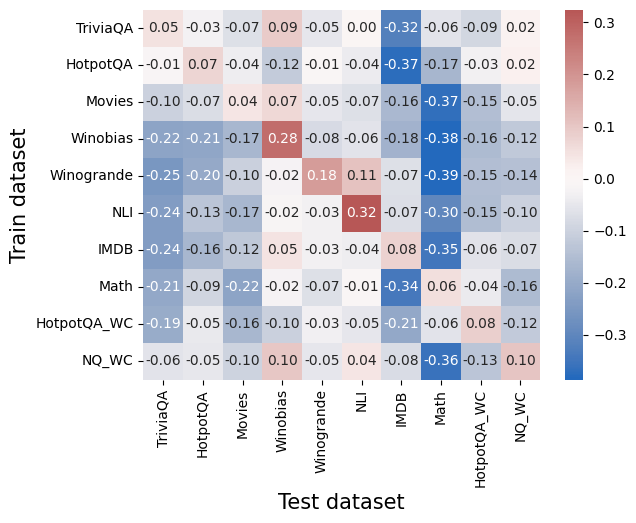
The image presents a heatmap visualizing the correlation coefficients between different datasets when used as training data versus when used as test data. The color intensity represents the strength and direction of the correlation, with red indicating positive correlation and blue indicating negative correlation. The heatmap is labeled with dataset names along both the x and y axes.
### Components/Axes
* **X-axis:** "Test dataset" - Lists the following datasets: TriviaQA, HotpotQA, Movies, Winobias, Winogrande, NLI, IMDB, Math, HotpotQA_WC, NQ_WC.
* **Y-axis:** "Train dataset" - Lists the following datasets: TriviaQA, HotpotQA, Movies, Winobias, Winogrande, NLI, IMDB, Math, HotpotQA_WC, NQ_WC.
* **Color Scale (Legend):** Located in the top-right corner. Ranges from -0.3 (dark blue) to 0.3 (dark red), with white representing 0.
* **Cells:** Each cell represents the correlation coefficient between a specific training dataset (row) and a specific test dataset (column).
### Detailed Analysis
The heatmap displays correlation coefficients, which are numerical values ranging from approximately -0.3 to 0.3. I will analyze each row (train dataset) and its corresponding correlation values with each column (test dataset).
* **TriviaQA (Train):**
* TriviaQA (Test): -0.05
* HotpotQA (Test): -0.03
* Movies (Test): 0.07
* Winobias (Test): 0.09
* Winogrande (Test): -0.05
* NLI (Test): 0.00
* IMDB (Test): -0.32
* Math (Test): -0.06
* HotpotQA_WC (Test): -0.09
* NQ_WC (Test): 0.02
* **HotpotQA (Train):**
* TriviaQA (Test): 0.07
* HotpotQA (Test): -0.04
* Movies (Test): -0.12
* Winobias (Test): -0.12
* Winogrande (Test): 0.04
* NLI (Test): 0.37
* IMDB (Test): -0.17
* Math (Test): -0.03
* HotpotQA_WC (Test): 0.08
* NQ_WC (Test): -0.03
* **Movies (Train):**
* TriviaQA (Test): -0.10
* HotpotQA (Test): -0.07
* Movies (Test): 0.04
* Winobias (Test): 0.07
* Winogrande (Test): -0.05
* NLI (Test): -0.07
* IMDB (Test): -0.16
* Math (Test): -0.37
* HotpotQA_WC (Test): -0.15
* NQ_WC (Test): -0.08
* **Winobias (Train):**
* TriviaQA (Test): -0.22
* HotpotQA (Test): -0.21
* Movies (Test): 0.28
* Winobias (Test): -0.08
* Winogrande (Test): 0.18
* NLI (Test): -0.18
* IMDB (Test): -0.38
* Math (Test): -0.16
* HotpotQA_WC (Test): -0.12
* NQ_WC (Test): -0.14
* **Winogrande (Train):**
* TriviaQA (Test): -0.25
* HotpotQA (Test): -0.20
* Movies (Test): -0.10
* Winobias (Test): 0.02
* Winogrande (Test): 0.11
* NLI (Test): -0.07
* IMDB (Test): -0.39
* Math (Test): -0.15
* HotpotQA_WC (Test): -0.14
* NQ_WC (Test): -0.09
* **NLI (Train):**
* TriviaQA (Test): -0.24
* HotpotQA (Test): -0.13
* Movies (Test): -0.17
* Winobias (Test): -0.02
* Winogrande (Test): 0.03
* NLI (Test): 0.32
* IMDB (Test): -0.07
* Math (Test): -0.30
* HotpotQA_WC (Test): -0.15
* NQ_WC (Test): -0.10
* **IMDB (Train):**
* TriviaQA (Test): -0.24
* HotpotQA (Test): -0.16
* Movies (Test): -0.12
* Winobias (Test): 0.05
* Winogrande (Test): -0.03
* NLI (Test): -0.04
* IMDB (Test): 0.08
* Math (Test): -0.35
* HotpotQA_WC (Test): -0.06
* NQ_WC (Test): -0.07
* **Math (Train):**
* TriviaQA (Test): -0.21
* HotpotQA (Test): -0.09
* Movies (Test): -0.22
* Winobias (Test): -0.07
* Winogrande (Test): -0.01
* NLI (Test): -0.34
* IMDB (Test): -0.06
* Math (Test): 0.04
* HotpotQA_WC (Test): -0.16
* NQ_WC (Test): -0.04
* **HotpotQA_WC (Train):**
* TriviaQA (Test): -0.19
* HotpotQA (Test): -0.05
* Movies (Test): -0.16
* Winobias (Test): -0.03
* Winogrande (Test): -0.05
* NLI (Test): -0.21
* IMDB (Test): -0.06
* Math (Test): 0.08
* HotpotQA_WC (Test): -0.12
* NQ_WC (Test): -0.02
* **NQ_WC (Train):**
* TriviaQA (Test): -0.06
* HotpotQA (Test): -0.05
* Movies (Test): -0.10
* Winobias (Test): 0.08
* Winogrande (Test): -0.08
* NLI (Test): -0.36
* IMDB (Test): -0.13
* Math (Test): 0.01
* HotpotQA_WC (Test): -0.03
* NQ_WC (Test): -0.03
### Key Observations
* **Strong Negative Correlations:** IMDB consistently shows strong negative correlations with several datasets when used as a test set (e.g., -0.39 with Winogrande, -0.35 with Math).
* **NLI Self-Correlation:** NLI exhibits the strongest positive correlation with itself (0.32), as expected.
* **Winobias and Movies:** Winobias and Movies show a relatively strong positive correlation (0.28).
* **Math and Movies:** Math and Movies show a relatively strong negative correlation (-0.37).
* **WC Datasets:** The "WC" (presumably "With Context") datasets (HotpotQA_WC and NQ_WC) generally have lower correlation coefficients compared to their non-WC counterparts.
### Interpretation
This heatmap reveals how well performance on one dataset generalizes to other datasets. A positive correlation suggests that models performing well on one dataset are also likely to perform well on the other. Conversely, a negative correlation indicates that good performance on one dataset might not translate to good performance on the other.
The strong negative correlations involving IMDB suggest that this dataset is fundamentally different from the others, and models trained on IMDB might not generalize well to other tasks. The high self-correlation of NLI confirms that performance on this dataset is consistent.
The lower correlations involving the "WC" datasets suggest that adding context might alter the relationships between datasets, potentially making generalization more challenging.
The heatmap provides valuable insights for dataset selection and model training. It highlights which datasets are complementary (positive correlation) and which are divergent (negative correlation), guiding the development of more robust and generalizable models. The data suggests that the datasets are not interchangeable and that performance on one dataset does not guarantee performance on another.
DECODING INTELLIGENCE...