## Heatmap: Correlation Between Training and Test Datasets
### Overview
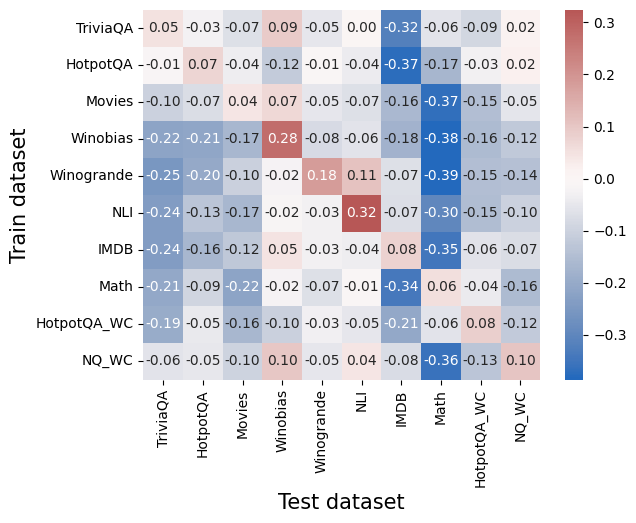
This heatmap visualizes the correlation coefficients between different question-answering datasets when used as training and test sets. Values range from -0.3 (blue) to +0.3 (red), with white indicating near-zero correlation. The matrix reveals patterns of positive/negative transferability between datasets.
### Components/Axes
- **X-axis (Test datasets)**: TriviaQA, HotpotQA, Movies, Winobias, Winogrande, NLI, IMDB, Math, HotpotQA_WC, NQ_WC
- **Y-axis (Train datasets)**: Same as X-axis, listed vertically
- **Color legend**:
- Red (+0.3): Strong positive correlation
- Blue (-0.3): Strong negative correlation
- White (0.0): No correlation
- **Values**: Numerical correlation coefficients (e.g., 0.05, -0.32)
### Detailed Analysis
1. **Diagonal values** (same train/test dataset):
- TriviaQA: 0.05
- HotpotQA: 0.07
- Movies: 0.07
- Winobias: 0.28
- Winogrande: 0.18
- NLI: 0.32
- IMDB: 0.08
- Math: 0.06
- HotpotQA_WC: 0.08
- NQ_WC: 0.10
2. **Notable positive correlations**:
- NLI ↔ IMDB: 0.08
- Winobias ↔ Winogrande: 0.18
- NQ_WC ↔ HotpotQA_WC: 0.10
3. **Notable negative correlations**:
- HotpotQA ↔ Math: -0.37
- Winobias ↔ Math: -0.38
- IMDb ↔ Math: -0.35
- Winogrande ↔ Math: -0.39
### Key Observations
1. **Self-correlation**: All datasets show moderate positive self-correlation (0.05–0.32), with NLI (0.32) and Winobias (0.28) showing the strongest.
2. **Math dataset**: Exhibits strong negative correlations (-0.34 to -0.39) with most other datasets, suggesting poor generalization.
3. **WC variants**: HotpotQA_WC and NQ_WC show moderate positive correlations with their base datasets (0.08–0.10).
4. **Winobias**: Has the strongest negative correlation with Math (-0.38) and moderate positive correlation with Winogrande (0.18).
### Interpretation
The heatmap demonstrates that:
- **Domain specificity**: Math shows poor transferability to other domains, suggesting fundamental differences in question types or reasoning requirements.
- **Semantic similarity**: Winobias and Winogrande show moderate positive correlation (0.18), indicating shared linguistic patterns.
- **WC adaptations**: The WC (with context) variants maintain moderate positive correlations with their base datasets, suggesting context augmentation improves generalization.
- **Outliers**: The extreme negative correlations (-0.37 to -0.39) between Math and other datasets highlight its unique characteristics, possibly requiring specialized models.
This matrix provides critical insights for dataset selection in transfer learning scenarios, emphasizing the importance of domain alignment between training and test sets.