## Bar Charts: Throughput vs. Packet Delays for Different Protocols
### Overview
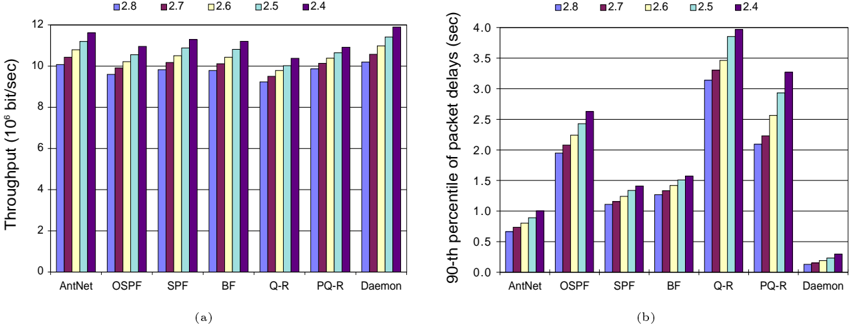
The image presents two bar charts comparing the throughput and 90th percentile of packet delays for various network protocols (AntNet, OSPF, SPF, BF, Q-R, PQ-R, and Daemon) under different conditions (2.8, 2.7, 2.6, 2.5, and 2.4). The first chart (a) shows throughput in 10^6 bits/sec, while the second chart (b) displays the 90th percentile of packet delays in seconds.
### Components/Axes
**Chart (a): Throughput**
* **Title:** Throughput (10^6 bit/sec)
* **Y-axis:** Throughput (10^6 bit/sec), with scale from 0 to 12. Markers at 0, 2, 4, 6, 8, 10, and 12.
* **X-axis:** Network protocols: AntNet, OSPF, SPF, BF, Q-R, PQ-R, Daemon
* **Legend:** Located at the top of the chart.
* Light Blue: 2.8
* Maroon: 2.7
* Yellow: 2.6
* Light Green: 2.5
* Dark Purple: 2.4
**Chart (b): Packet Delays**
* **Title:** 90-th percentile of packet delays (sec)
* **Y-axis:** 90-th percentile of packet delays (sec), with scale from 0.0 to 4.0. Markers at 0.0, 0.5, 1.0, 1.5, 2.0, 2.5, 3.0, 3.5, and 4.0.
* **X-axis:** Network protocols: AntNet, OSPF, SPF, BF, Q-R, PQ-R, Daemon
* **Legend:** Located at the top of the chart.
* Light Blue: 2.8
* Maroon: 2.7
* Yellow: 2.6
* Light Green: 2.5
* Dark Purple: 2.4
### Detailed Analysis
**Chart (a): Throughput**
* **AntNet:** Throughput values are approximately: 2.8 (10.0), 2.7 (10.2), 2.6 (10.5), 2.5 (10.7), 2.4 (11.0)
* Trend: Throughput increases slightly as the condition decreases from 2.8 to 2.4.
* **OSPF:** Throughput values are approximately: 2.8 (9.5), 2.7 (9.7), 2.6 (10.0), 2.5 (10.2), 2.4 (10.5)
* Trend: Throughput increases slightly as the condition decreases from 2.8 to 2.4.
* **SPF:** Throughput values are approximately: 2.8 (9.7), 2.7 (9.9), 2.6 (10.2), 2.5 (10.4), 2.4 (10.7)
* Trend: Throughput increases slightly as the condition decreases from 2.8 to 2.4.
* **BF:** Throughput values are approximately: 2.8 (9.8), 2.7 (10.0), 2.6 (10.3), 2.5 (10.5), 2.4 (10.8)
* Trend: Throughput increases slightly as the condition decreases from 2.8 to 2.4.
* **Q-R:** Throughput values are approximately: 2.8 (9.9), 2.7 (10.1), 2.6 (10.4), 2.5 (10.6), 2.4 (10.9)
* Trend: Throughput increases slightly as the condition decreases from 2.8 to 2.4.
* **PQ-R:** Throughput values are approximately: 2.8 (10.0), 2.7 (10.2), 2.6 (10.5), 2.5 (10.7), 2.4 (11.0)
* Trend: Throughput increases slightly as the condition decreases from 2.8 to 2.4.
* **Daemon:** Throughput values are approximately: 2.8 (11.2), 2.7 (11.4), 2.6 (11.7), 2.5 (11.9), 2.4 (12.2)
* Trend: Throughput increases slightly as the condition decreases from 2.8 to 2.4.
**Chart (b): Packet Delays**
* **AntNet:** Packet delay values are approximately: 2.8 (0.7), 2.7 (0.8), 2.6 (0.9), 2.5 (1.0), 2.4 (1.1)
* Trend: Packet delay increases slightly as the condition decreases from 2.8 to 2.4.
* **OSPF:** Packet delay values are approximately: 2.8 (2.0), 2.7 (2.1), 2.6 (2.3), 2.5 (2.4), 2.4 (2.6)
* Trend: Packet delay increases slightly as the condition decreases from 2.8 to 2.4.
* **SPF:** Packet delay values are approximately: 2.8 (1.1), 2.7 (1.2), 2.6 (1.3), 2.5 (1.4), 2.4 (1.5)
* Trend: Packet delay increases slightly as the condition decreases from 2.8 to 2.4.
* **BF:** Packet delay values are approximately: 2.8 (1.2), 2.7 (1.3), 2.6 (1.4), 2.5 (1.5), 2.4 (1.6)
* Trend: Packet delay increases slightly as the condition decreases from 2.8 to 2.4.
* **Q-R:** Packet delay values are approximately: 2.8 (3.1), 2.7 (3.3), 2.6 (3.5), 2.5 (3.7), 2.4 (3.9)
* Trend: Packet delay increases slightly as the condition decreases from 2.8 to 2.4.
* **PQ-R:** Packet delay values are approximately: 2.8 (2.2), 2.7 (2.4), 2.6 (2.6), 2.5 (2.8), 2.4 (3.0)
* Trend: Packet delay increases slightly as the condition decreases from 2.8 to 2.4.
* **Daemon:** Packet delay values are approximately: 2.8 (0.1), 2.7 (0.1), 2.6 (0.2), 2.5 (0.2), 2.4 (0.3)
* Trend: Packet delay increases slightly as the condition decreases from 2.8 to 2.4.
### Key Observations
* For all protocols, throughput increases slightly as the condition decreases from 2.8 to 2.4.
* For all protocols, packet delay increases slightly as the condition decreases from 2.8 to 2.4.
* Daemon has the highest throughput and the lowest packet delay compared to other protocols.
* Q-R has the highest packet delay among all protocols.
### Interpretation
The charts suggest that as the condition decreases from 2.8 to 2.4, the network throughput slightly increases, but so does the packet delay. This could indicate a trade-off between throughput and latency under different network conditions. Daemon appears to be the most efficient protocol in terms of both throughput and packet delay, while Q-R exhibits the highest packet delay, potentially indicating inefficiencies in its packet handling. The other protocols (AntNet, OSPF, SPF, BF, PQ-R) fall in between, with varying degrees of throughput and packet delay performance. The specific meaning of the conditions (2.8, 2.7, 2.6, 2.5, 2.4) is not provided, but they likely represent different network parameters or configurations.