## Bar Charts: Throughput and 90th Percentile Packet Delays
### Overview
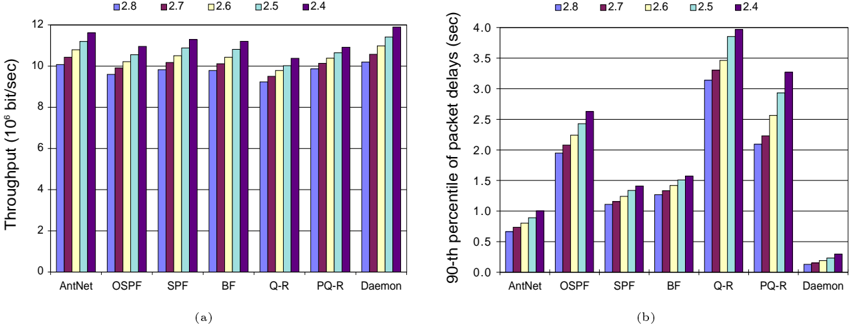
The image presents two adjacent bar charts, labeled (a) and (b). Chart (a) displays throughput (in 10^6 bit/sec) for different network configurations, while chart (b) shows the 90th percentile of packet delays (in seconds) for the same configurations. Both charts use the same network configurations on the x-axis and different values of a parameter (2.8, 2.7, 2.6, 2.5, 2.4) represented by different colors.
### Components/Axes
* **Chart (a):**
* **X-axis:** Network Configurations: AntNet, OSPF, SPF, BF, Q-R, PQ-R, Daemon.
* **Y-axis:** Throughput (10^6 bit/sec), ranging from 0 to 12.
* **Legend:** Located at the top-right, with colors corresponding to parameter values:
* 2.8 (Dark Blue)
* 2.7 (Blue)
* 2.6 (Purple)
* 2.5 (Green)
* 2.4 (Light Green)
* **Chart (b):**
* **X-axis:** Network Configurations: AntNet, OSPF, SPF, BF, Q-R, PQ-R, Daemon.
* **Y-axis:** 90th percentile of packet delays (sec), ranging from 0 to 4.
* **Legend:** Located at the top-right, identical to chart (a):
* 2.8 (Dark Blue)
* 2.7 (Blue)
* 2.6 (Purple)
* 2.5 (Green)
* 2.4 (Light Green)
### Detailed Analysis or Content Details
**Chart (a) - Throughput:**
* **AntNet:**
* 2.8: ~10.2 (10^6 bit/sec)
* 2.7: ~9.8 (10^6 bit/sec)
* 2.6: ~9.4 (10^6 bit/sec)
* 2.5: ~9.0 (10^6 bit/sec)
* 2.4: ~8.6 (10^6 bit/sec)
* **OSPF:**
* 2.8: ~9.6 (10^6 bit/sec)
* 2.7: ~9.2 (10^6 bit/sec)
* 2.6: ~8.8 (10^6 bit/sec)
* 2.5: ~8.4 (10^6 bit/sec)
* 2.4: ~8.0 (10^6 bit/sec)
* **SPF:**
* 2.8: ~10.8 (10^6 bit/sec)
* 2.7: ~10.4 (10^6 bit/sec)
* 2.6: ~10.0 (10^6 bit/sec)
* 2.5: ~9.6 (10^6 bit/sec)
* 2.4: ~9.2 (10^6 bit/sec)
* **BF:**
* 2.8: ~11.2 (10^6 bit/sec)
* 2.7: ~10.8 (10^6 bit/sec)
* 2.6: ~10.4 (10^6 bit/sec)
* 2.5: ~10.0 (10^6 bit/sec)
* 2.4: ~9.6 (10^6 bit/sec)
* **Q-R:**
* 2.8: ~9.0 (10^6 bit/sec)
* 2.7: ~8.6 (10^6 bit/sec)
* 2.6: ~8.2 (10^6 bit/sec)
* 2.5: ~7.8 (10^6 bit/sec)
* 2.4: ~7.4 (10^6 bit/sec)
* **PQ-R:**
* 2.8: ~10.4 (10^6 bit/sec)
* 2.7: ~10.0 (10^6 bit/sec)
* 2.6: ~9.6 (10^6 bit/sec)
* 2.5: ~9.2 (10^6 bit/sec)
* 2.4: ~8.8 (10^6 bit/sec)
* **Daemon:**
* 2.8: ~11.6 (10^6 bit/sec)
* 2.7: ~11.2 (10^6 bit/sec)
* 2.6: ~10.8 (10^6 bit/sec)
* 2.5: ~10.4 (10^6 bit/sec)
* 2.4: ~10.0 (10^6 bit/sec)
**Chart (b) - 90th Percentile Packet Delays:**
* **AntNet:**
* 2.8: ~3.2 (sec)
* 2.7: ~2.8 (sec)
* 2.6: ~2.4 (sec)
* 2.5: ~2.0 (sec)
* 2.4: ~1.6 (sec)
* **OSPF:**
* 2.8: ~2.4 (sec)
* 2.7: ~2.0 (sec)
* 2.6: ~1.6 (sec)
* 2.5: ~1.2 (sec)
* 2.4: ~0.8 (sec)
* **SPF:**
* 2.8: ~1.6 (sec)
* 2.7: ~1.2 (sec)
* 2.6: ~0.8 (sec)
* 2.5: ~0.4 (sec)
* 2.4: ~0.0 (sec)
* **BF:**
* 2.8: ~1.2 (sec)
* 2.7: ~0.8 (sec)
* 2.6: ~0.4 (sec)
* 2.5: ~0.0 (sec)
* 2.4: ~0.0 (sec)
* **Q-R:**
* 2.8: ~3.6 (sec)
* 2.7: ~3.2 (sec)
* 2.6: ~2.8 (sec)
* 2.5: ~2.4 (sec)
* 2.4: ~2.0 (sec)
* **PQ-R:**
* 2.8: ~3.0 (sec)
* 2.7: ~2.6 (sec)
* 2.6: ~2.2 (sec)
* 2.5: ~1.8 (sec)
* 2.4: ~1.4 (sec)
* **Daemon:**
* 2.8: ~0.4 (sec)
* 2.7: ~0.3 (sec)
* 2.6: ~0.2 (sec)
* 2.5: ~0.1 (sec)
* 2.4: ~0.0 (sec)
### Key Observations
* **Throughput:** Generally, throughput decreases as the parameter value decreases for all network configurations. Daemon consistently exhibits the highest throughput, followed by BF and SPF. Q-R has the lowest throughput.
* **Packet Delays:** Packet delays generally increase as the parameter value increases. Q-R exhibits the highest packet delays, while Daemon has the lowest.
* **Trade-off:** There appears to be a trade-off between throughput and packet delays. Configurations with higher throughput (Daemon, BF, SPF) tend to have lower packet delays, and vice versa (Q-R).
### Interpretation
The data suggests that the parameter value (2.8 to 2.4) significantly impacts both throughput and packet delays in these network configurations. The different network configurations exhibit varying sensitivities to this parameter. Daemon appears to be the most efficient configuration, offering high throughput and low packet delays. Q-R, conversely, demonstrates the poorest performance in both metrics.
The inverse relationship between throughput and packet delays indicates a fundamental network performance trade-off. Increasing throughput often comes at the cost of increased latency (packet delays), and reducing latency may limit the overall throughput. The optimal parameter value likely depends on the specific application requirements – prioritizing throughput for bandwidth-intensive tasks or minimizing latency for real-time applications.
The consistent trends across all configurations suggest that the parameter influences a core aspect of network operation, potentially related to congestion control, routing efficiency, or resource allocation. Further investigation would be needed to determine the precise mechanism by which this parameter affects network performance.