\n
## Bar Chart: Performance Comparison of Language Models
### Overview
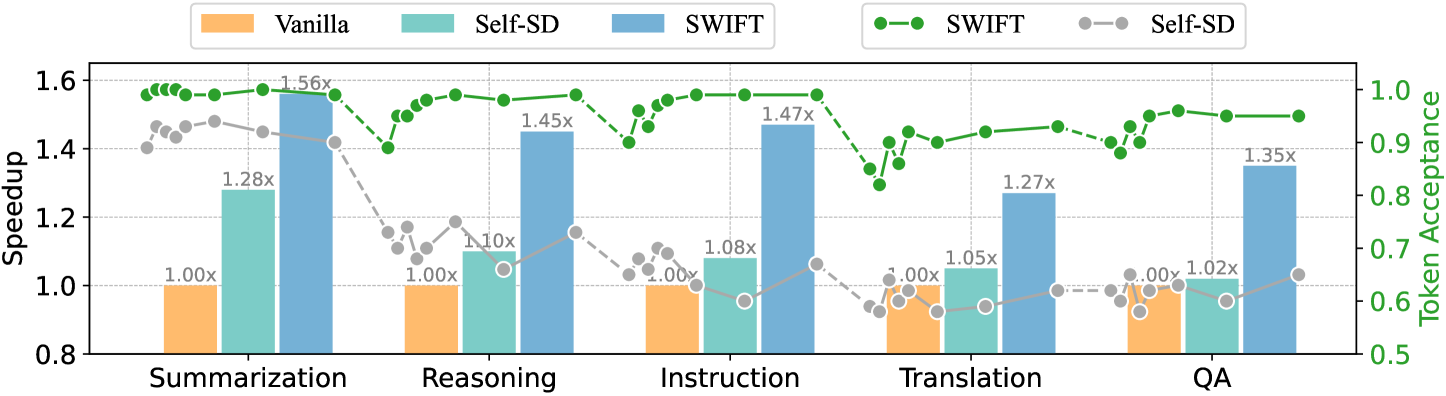
This bar chart compares the performance of three language models – Vanilla, Self-SD, and SWIFT – across five different tasks: Summarization, Reasoning, Instruction, Translation, and QA (Question Answering). The performance is measured using two metrics: Speedup (left y-axis) and Token Acceptance (right y-axis). The chart uses bar graphs to represent Speedup and line graphs to represent Token Acceptance.
### Components/Axes
* **X-axis:** Task type (Summarization, Reasoning, Instruction, Translation, QA)
* **Left Y-axis:** Speedup (Scale: 0.8 to 1.6)
* **Right Y-axis:** Token Acceptance (Scale: 0.5 to 1.0)
* **Legend:**
* Vanilla (Yellow) - Represented by yellow bars.
* Self-SD (Light Blue) - Represented by light blue bars.
* SWIFT (Dark Blue) - Represented by dark blue bars.
* SWIFT (Green Line with filled circles) - Represents Token Acceptance for SWIFT.
* Self-SD (Light Blue Line with empty circles) - Represents Token Acceptance for Self-SD.
### Detailed Analysis
The chart presents data for each task, showing the Speedup and Token Acceptance for each model.
**Summarization:**
* Vanilla Speedup: Approximately 1.00x
* Self-SD Speedup: Approximately 1.28x
* SWIFT Speedup: Approximately 1.56x
* SWIFT Token Acceptance: Starts at approximately 0.95 and decreases to approximately 0.92.
* Self-SD Token Acceptance: Starts at approximately 0.85 and increases to approximately 0.88.
**Reasoning:**
* Vanilla Speedup: Approximately 1.00x
* Self-SD Speedup: Approximately 1.10x
* SWIFT Speedup: Approximately 1.45x
* SWIFT Token Acceptance: Relatively flat, around 0.94-0.95.
* Self-SD Token Acceptance: Starts at approximately 0.75 and increases to approximately 0.82.
**Instruction:**
* Vanilla Speedup: Approximately 1.00x
* Self-SD Speedup: Approximately 1.08x
* SWIFT Speedup: Approximately 1.47x
* SWIFT Token Acceptance: Starts at approximately 0.95 and decreases to approximately 0.93.
* Self-SD Token Acceptance: Relatively flat, around 0.70-0.72.
**Translation:**
* Vanilla Speedup: Approximately 1.05x
* Self-SD Speedup: Approximately 1.27x
* SWIFT Speedup: Approximately 1.00x
* SWIFT Token Acceptance: Starts at approximately 0.93 and decreases to approximately 0.88.
* Self-SD Token Acceptance: Relatively flat, around 0.68-0.70.
**QA:**
* Vanilla Speedup: Approximately 1.02x
* Self-SD Speedup: Approximately 1.35x
* SWIFT Speedup: Approximately 1.00x
* SWIFT Token Acceptance: Relatively flat, around 0.93-0.94.
* Self-SD Token Acceptance: Starts at approximately 0.65 and increases to approximately 0.68.
### Key Observations
* SWIFT consistently demonstrates the highest Speedup across most tasks (Summarization, Reasoning, Instruction).
* Self-SD generally shows a moderate improvement in Speedup compared to Vanilla.
* Token Acceptance for SWIFT is generally high and relatively stable.
* Token Acceptance for Self-SD is lower than SWIFT but shows a slight increasing trend across tasks.
* Vanilla consistently has a Speedup of approximately 1.00x, indicating no performance improvement.
* The Translation task shows a relatively low Speedup for SWIFT compared to other tasks.
### Interpretation
The data suggests that the SWIFT model significantly outperforms Vanilla and Self-SD in terms of Speedup for most of the evaluated tasks. This indicates that SWIFT is more efficient at processing these tasks. The higher Token Acceptance for SWIFT suggests that it is also more reliable in generating appropriate tokens. Self-SD provides a moderate improvement over Vanilla, but it does not reach the performance level of SWIFT. The relatively low Speedup for SWIFT in the Translation task could indicate that this task presents unique challenges for the model, or that the benefits of SWIFT are less pronounced in this specific domain. The increasing trend in Token Acceptance for Self-SD might suggest that the model is learning and improving its token generation capabilities as it processes more complex tasks. The combination of Speedup and Token Acceptance provides a comprehensive view of the model's performance, highlighting its efficiency and reliability.