## Combination Bar and Line Chart: Performance Comparison of Vanilla, Self-SD, and SWIFT Methods
### Overview
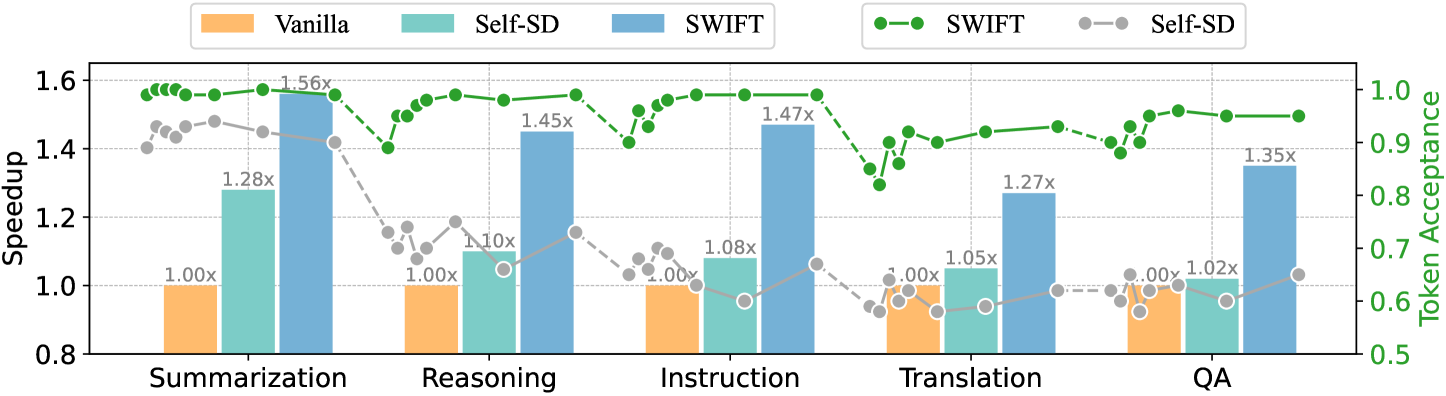
This image is a technical performance chart comparing three methods—Vanilla, Self-SD, and SWIFT—across five different natural language processing tasks. It uses a dual-axis design: a bar chart on the primary (left) y-axis to show "Speedup" and a line chart on the secondary (right) y-axis to show "Token Acceptance." The chart demonstrates that the SWIFT method consistently achieves the highest speedup and maintains high token acceptance across all tasks.
### Components/Axes
* **Chart Type:** Combination bar and line chart with dual y-axes.
* **Primary Y-Axis (Left):** Labeled "Speedup." Scale ranges from 0.8 to 1.6, with major gridlines at 0.2 intervals. This axis corresponds to the bar heights.
* **Secondary Y-Axis (Right):** Labeled "Token Acceptance." Scale ranges from 0.5 to 1.0, with major gridlines at 0.1 intervals. This axis corresponds to the line data points.
* **X-Axis:** Lists five task categories. From left to right: "Summarization", "Reasoning", "Instruction", "Translation", "QA".
* **Legend (Top-Center):** Contains two sections.
* **Bar Legend (Left):** Defines the three bar colors: Orange for "Vanilla", Teal for "Self-SD", Blue for "SWIFT".
* **Line Legend (Right):** Defines the two line series: A green dashed line with circle markers for "SWIFT", and a gray dashed line with circle markers for "Self-SD". The "Vanilla" method does not have a corresponding line for Token Acceptance.
* **Data Labels:** Each bar has a numerical label at its top indicating the exact speedup multiplier (e.g., "1.00x", "1.56x").
### Detailed Analysis
The data is grouped by task. For each task, three bars are shown, and two lines are plotted across the entire chart.
**1. Speedup (Bar Chart - Primary Y-Axis):**
* **Summarization:**
* Vanilla (Orange): 1.00x
* Self-SD (Teal): 1.28x
* SWIFT (Blue): 1.56x
* **Reasoning:**
* Vanilla (Orange): 1.00x
* Self-SD (Teal): 1.10x
* SWIFT (Blue): 1.45x
* **Instruction:**
* Vanilla (Orange): 1.00x
* Self-SD (Teal): 1.08x
* SWIFT (Blue): 1.47x
* **Translation:**
* Vanilla (Orange): 1.00x
* Self-SD (Teal): 1.05x
* SWIFT (Blue): 1.27x
* **QA:**
* Vanilla (Orange): 1.00x
* Self-SD (Teal): 1.02x
* SWIFT (Blue): 1.35x
**Trend Verification (Speedup):** The blue SWIFT bars are consistently the tallest in every task group, indicating the highest speedup. The teal Self-SD bars are always taller than the orange Vanilla bars but shorter than the blue SWIFT bars. The orange Vanilla bars are all at the baseline of 1.00x.
**2. Token Acceptance (Line Chart - Secondary Y-Axis):**
* **SWIFT (Green dashed line with circles):** The line starts high (≈0.98) for Summarization, dips slightly for Reasoning (≈0.95), peaks for Instruction (≈0.98), dips for Translation (≈0.90), and ends high for QA (≈0.95). The trend is generally high and stable, with a notable dip at the Translation task.
* **Self-SD (Gray dashed line with circles):** The line starts moderately high for Summarization (≈0.90), drops significantly for Reasoning (≈0.70), recovers slightly for Instruction (≈0.65), dips again for Translation (≈0.60), and rises slightly for QA (≈0.65). The trend is more volatile and consistently lower than the SWIFT line.
**Spatial Grounding (Lines):** The green SWIFT line is positioned in the upper portion of the chart area, corresponding to values between 0.9 and 1.0 on the right axis. The gray Self-SD line is positioned in the middle to lower portion, corresponding to values between 0.6 and 0.9.
### Key Observations
1. **Dominant Performance of SWIFT:** The SWIFT method (blue bars, green line) outperforms the other two methods on both metrics across all five tasks. Its speedup advantage is most pronounced in Summarization (1.56x) and Instruction (1.47x).
2. **Baseline Comparison:** The "Vanilla" method serves as a consistent baseline with a speedup of 1.00x for all tasks. It has no associated token acceptance data.
3. **Self-SD Performance:** Self-SD provides a modest speedup over Vanilla (ranging from 1.02x to 1.28x) but exhibits significantly lower and more variable token acceptance rates compared to SWIFT.
4. **Task-Specific Anomaly:** The "Translation" task shows the smallest speedup advantage for SWIFT (1.27x) and the lowest token acceptance point for both SWIFT (≈0.90) and Self-SD (≈0.60), suggesting it may be a more challenging task for these methods.
5. **Metric Relationship:** There is a positive correlation between higher speedup and higher token acceptance when comparing the SWIFT and Self-SD methods. SWIFT leads in both.
### Interpretation
This chart presents a compelling case for the SWIFT method as a superior optimization technique. The data suggests that SWIFT not only accelerates model inference (higher Speedup) but does so while maintaining or even improving the quality or acceptance rate of the generated tokens (higher Token Acceptance). This is a significant finding, as optimizations often trade off speed for quality.
The consistent underperformance of Self-SD relative to SWIFT on both metrics indicates that the mechanism behind SWIFT is more effective. The Vanilla baseline's flat 1.00x speedup confirms it is the unoptimized reference point.
The dip in performance for the "Translation" task for all methods could imply that translation requires a different kind of processing or has inherent complexities that are less amenable to the specific optimizations provided by Self-SD and SWIFT. This identifies a potential area for further investigation and targeted improvement.
In summary, the chart is designed to demonstrate that SWIFT achieves the desirable outcome of making the model faster without compromising—and often improving—the acceptability of its outputs, making it a robust solution across diverse language tasks.