## Bar Chart: Model Performance Comparison Across Tasks
### Overview
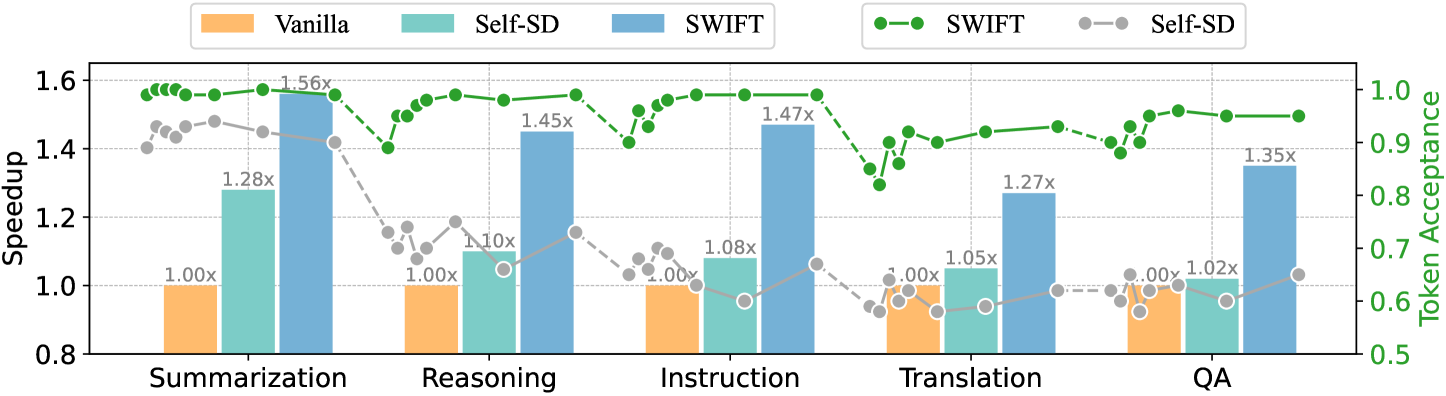
The chart compares three models (Vanilla, Self-SD, SWIFT) across five tasks (Summarization, Reasoning, Instruction, Translation, QA) using two metrics: **Speedup** (left y-axis) and **Token Acceptance** (right y-axis). Speedup values are represented as bars, while Token Acceptance is shown as lines. The legend at the top maps colors to models and line styles.
---
### Components/Axes
- **X-axis**: Tasks (Summarization, Reasoning, Instruction, Translation, QA).
- **Left Y-axis (Speedup)**: Scale from 1.0 to 1.6 (multiplicative factor).
- **Right Y-axis (Token Acceptance)**: Scale from 0.5 to 1.0.
- **Legend**:
- **Vanilla**: Orange bars.
- **Self-SD**: Teal bars.
- **SWIFT**: Blue bars.
- **SWIFT Token Acceptance**: Dashed green line.
- **Self-SD Token Acceptance**: Dotted gray line.
---
### Detailed Analysis
#### Speedup (Bars)
- **Summarization**:
- Vanilla: 1.00x
- Self-SD: 1.28x
- SWIFT: 1.56x
- **Reasoning**:
- Vanilla: 1.00x
- Self-SD: 1.10x
- SWIFT: 1.45x
- **Instruction**:
- Vanilla: 1.00x
- Self-SD: 1.08x
- SWIFT: 1.47x
- **Translation**:
- Vanilla: 1.00x
- Self-SD: 1.05x
- SWIFT: 1.27x
- **QA**:
- Vanilla: 1.00x
- Self-SD: 1.02x
- SWIFT: 1.35x
#### Token Acceptance (Lines)
- **SWIFT** (dashed green):
- Summarization: ~1.0
- Reasoning: ~1.0
- Instruction: ~1.0
- Translation: ~1.0
- QA: ~1.0
- **Self-SD** (dotted gray):
- Summarization: ~1.0
- Reasoning: ~1.0
- Instruction: ~1.0
- Translation: ~1.0
- QA: ~1.0
---
### Key Observations
1. **Speedup Trends**:
- SWIFT consistently achieves the highest speedup across all tasks (1.27x–1.56x).
- Self-SD shows moderate improvements (1.02x–1.28x).
- Vanilla remains at 1.00x (baseline).
2. **Token Acceptance**:
- Both SWIFT and Self-SD maintain near-perfect token acceptance (~1.0) across all tasks.
- No significant deviation from the baseline (1.0).
---
### Interpretation
- **Model Efficiency**: SWIFT demonstrates superior computational efficiency, achieving speedups of 1.27x–1.56x over Vanilla without compromising token acceptance. This suggests architectural or algorithmic optimizations in SWIFT.
- **Self-SD Performance**: While Self-SD improves speed moderately (1.02x–1.28x), its gains are less pronounced than SWIFT’s, indicating potential trade-offs in its design.
- **Token Acceptance Stability**: The near-constant token acceptance (~1.0) for both SWIFT and Self-SD implies that speed improvements do not degrade output quality, highlighting a critical balance between efficiency and accuracy.
---
### Spatial Grounding & Verification
- **Legend Placement**: Top-center, clearly aligned with bar/line colors.
- **Color Consistency**:
- SWIFT bars (blue) match dashed green line (Token Acceptance).
- Self-SD bars (teal) match dotted gray line.
- **Axis Alignment**: Dual y-axes ensure clear separation of metrics without overlap.
---
### Conclusion
The chart underscores SWIFT’s dominance in speedup while maintaining token acceptance parity with baseline models. This positions SWIFT as a highly efficient solution for the evaluated tasks, with Self-SD offering incremental improvements. The stability of token acceptance across models suggests robustness in handling task-specific nuances.