# Technical Data Extraction: Training Metrics Comparison
This document provides a comprehensive extraction of data from a series of four line charts comparing different synchronization intervals and off-policy methods in a machine learning training context.
## 1. Metadata and Global Legend
* **Image Type:** Multi-panel line chart (4 subplots).
* **Language:** English.
* **Legend Location:** Top center, spanning the width of the image.
* **Data Series (Legend):**
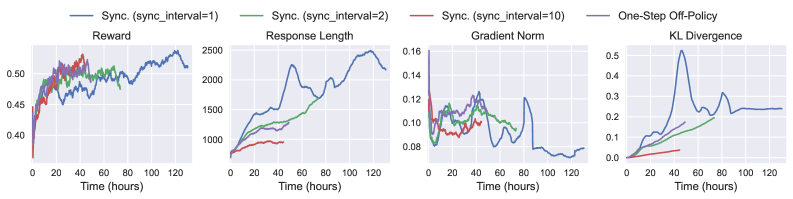
1. **Blue Line:** `Sync. (sync_interval=1)`
2. **Green Line:** `Sync. (sync_interval=2)`
3. **Red Line:** `Sync. (sync_interval=10)`
4. **Purple Line:** `One-Step Off-Policy`
---
## 2. Component Analysis (Subplots)
All subplots share a common X-axis: **Time (hours)**, ranging from 0 to approximately 130.
### Subplot A: Reward
* **Y-Axis Range:** 0.40 to 0.50+
* **Trend Analysis:**
* **Sync. (interval=1) [Blue]:** Shows the longest duration. It has a volatile upward trend, peaking near 0.53 around hour 120 before a slight dip.
* **Sync. (interval=2) [Green]:** Rapid initial climb, stabilizing around 0.48–0.50 before ending at hour 75.
* **Sync. (interval=10) [Red]:** Steepest initial climb, reaching ~0.52 by hour 40, then terminating.
* **One-Step Off-Policy [Purple]:** Similar trajectory to interval=10, reaching ~0.51 by hour 45.
### Subplot B: Response Length
* **Y-Axis Range:** 1000 to 2500
* **Trend Analysis:**
* **Sync. (interval=1) [Blue]:** Exhibits significant fluctuations. It rises to 2250 (hour 50), drops to 1750 (hour 75), then climbs to a peak of 2500 (hour 110).
* **Sync. (interval=2) [Green]:** Steady, linear-like increase from 800 to ~1750 over 75 hours.
* **Sync. (interval=10) [Red]:** Slowest growth, plateauing around 1000 by hour 40.
* **One-Step Off-Policy [Purple]:** Moderate growth, reaching ~1300 by hour 45.
### Subplot C: Gradient Norm
* **Y-Axis Range:** 0.08 to 0.16
* **Trend Analysis:**
* **Sync. (interval=1) [Blue]:** Highly volatile. Starts high (~0.12), fluctuates between 0.08 and 0.13, and ends at its lowest point (~0.08) after hour 100.
* **Sync. (interval=2) [Green]:** Fluctuates between 0.08 and 0.12, ending near 0.09 at hour 75.
* **Sync. (interval=10) [Red]:** Starts at 0.12, drops and stabilizes around 0.09–0.10.
* **One-Step Off-Policy [Purple]:** Starts with a massive spike at 0.16, then settles into the 0.10–0.12 range.
### Subplot D: KL Divergence
* **Y-Axis Range:** 0.0 to 0.5
* **Trend Analysis:**
* **Sync. (interval=1) [Blue]:** Shows a massive spike to 0.52 at hour 50, followed by a sharp drop and stabilization around 0.25 from hour 100 onwards.
* **Sync. (interval=2) [Green]:** Steady upward slope, reaching 0.20 by hour 75.
* **Sync. (interval=10) [Red]:** Very low, nearly flat growth, staying below 0.05.
* **One-Step Off-Policy [Purple]:** Moderate upward slope, reaching ~0.18 by hour 45.
---
## 3. Summary Data Table (Approximate Values)
| Metric | Sync (Int=1) [Blue] | Sync (Int=2) [Green] | Sync (Int=10) [Red] | One-Step Off-Policy [Purple] |
| :--- | :--- | :--- | :--- | :--- |
| **Max Time (h)** | ~130 | ~75 | ~40 | ~45 |
| **Final Reward** | ~0.51 | ~0.49 | ~0.52 | ~0.50 |
| **Final Resp. Len** | ~2200 | ~1750 | ~950 | ~1300 |
| **Final Grad Norm** | ~0.08 | ~0.09 | ~0.10 | ~0.11 |
| **Final KL Div.** | ~0.24 | ~0.20 | ~0.04 | ~0.17 |
## 4. Key Observations
1. **Training Duration:** The `Sync. (sync_interval=1)` configuration is the only one that runs for the full 130-hour duration shown.
2. **Instability:** The `sync_interval=1` (Blue) method shows high instability in Response Length and KL Divergence around the 50-hour mark, suggesting a significant policy shift or instability during that phase of training.
3. **Efficiency:** Higher sync intervals (Red/Green) appear to reach higher rewards faster but were terminated earlier in this visualization.